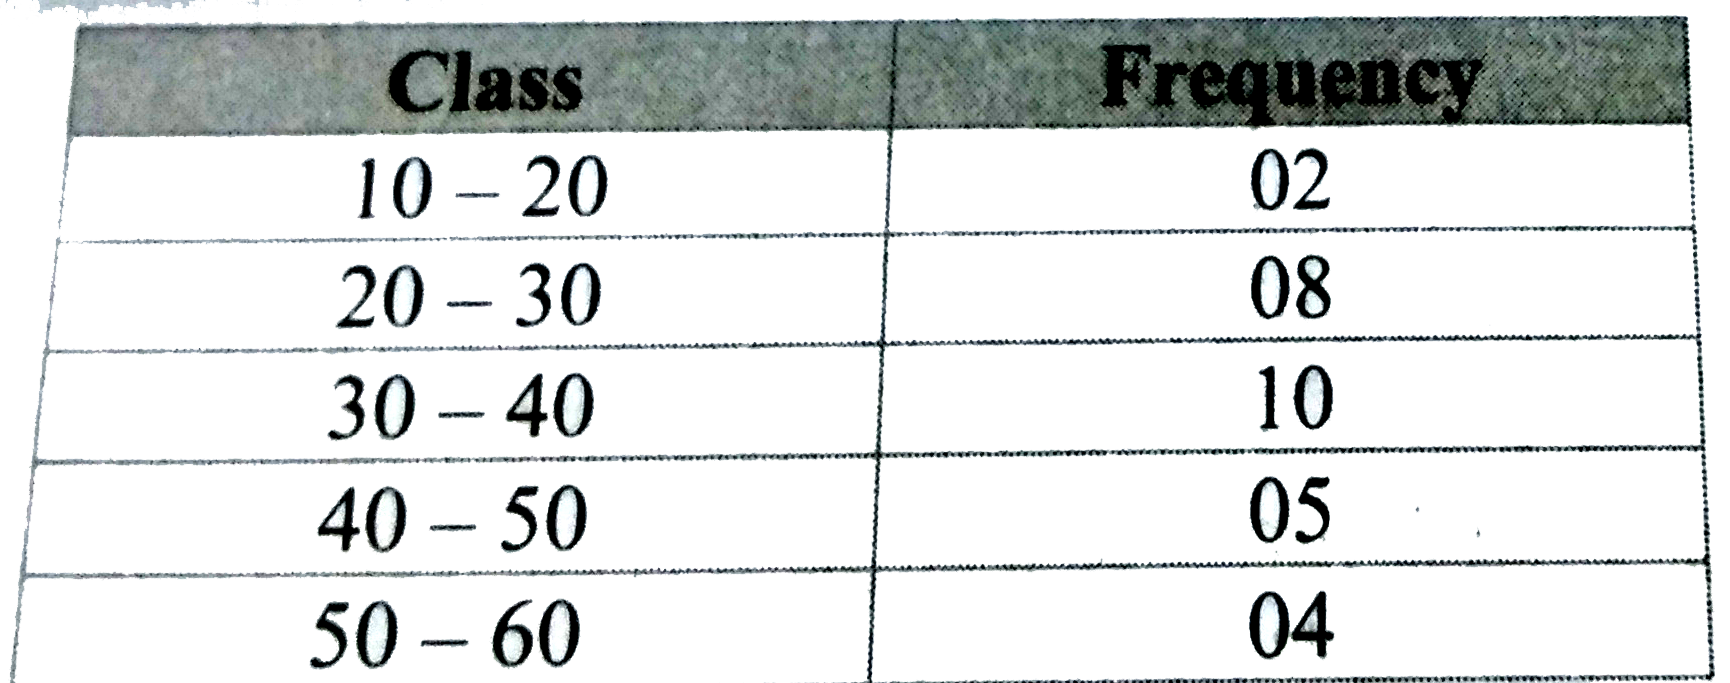
Draw the Histogram for the following frequency distribution.

Video Solution
|
Answer
Step by step video & image solution for Draw the Histogram for the following frequency distribution. by Maths experts to help you in doubts & scoring excellent marks in Class 10 exams.
Updated on:21/07/2023Topper's Solved these Questions
- STATISTICSBOOK - TARGET PUBLICATIONCHAPTER - STATISTICSEXERCISE - Practise Set 6.1
6 Videos
- STATISTICSBOOK - TARGET PUBLICATIONCHAPTER - STATISTICSEXERCISE - Practise Set 6.2
4 Videos
- STATISTICSBOOK - TARGET PUBLICATIONCHAPTER - STATISTICSEXERCISE - Apply your knowledge
5 Videos
- SIMILARITY BOOK - TARGET PUBLICATIONCHAPTER - SIMILARITY EXERCISE - Chapter Assessment
19 Videos
- TRIGONOMETRY BOOK - TARGET PUBLICATIONCHAPTER - TRIGONOMETRY EXERCISE - Chapter Assessment
18 Videos
Similar Questions
Knowledge Check
To draw a histogram to represent the following frequency distribution.
Class Interval 5−1010−1515−2525−4545−75
Frequency 6 12 10 8 15
The adjusted frequency for the class 25−45 isA6B5C3D2
Draw a histogram of the following frequency distribution and use it to calculate the mode
View SolutionConstruct a histogram for the following frequency distribution :

View SolutionDraw a histogram of the following data

View SolutionDraw a histogram for the following data:

View SolutionDraw a histogram for the following data.

View SolutionDraw a less than ogive for the following frequency distribution.
View SolutionDraw frequency polygon for the following frequency distribution.

View Solution


