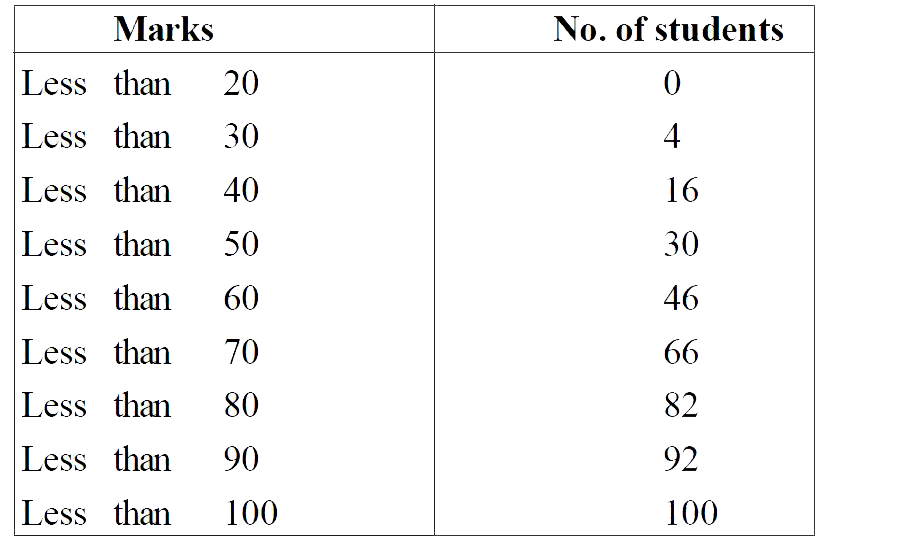
Draw a less than ogive for the following frequency distribution.
Step by step video & image solution for Draw a less than ogive for the following frequency distribution. by Maths experts to help you in doubts & scoring excellent marks in Class 10 exams.
Updated on:21/07/2023Topper's Solved these Questions
- CBSE BOARDS 2020BOOK - X BOARDSCHAPTER - CBSE BOARDS 2020EXERCISE - SECTION -A
22 Videos
- CBSE BOARDS 2020BOOK - X BOARDSCHAPTER - CBSE BOARDS 2020EXERCISE - QUESTION
42 Videos
- CBSE BOARDS 2020BOOK - X BOARDSCHAPTER - CBSE BOARDS 2020EXERCISE - SECTION C
34 Videos
- QUESTION PAPER 2022 TERM 1 SET 1 BASICBOOK - X BOARDSCHAPTER - QUESTION PAPER 2022 TERM 1 SET 1 BASICEXERCISE - SECTION-C (CASE STUDY)
10 Videos
Similar Questions
Draw a 'less than' ogive of the following data

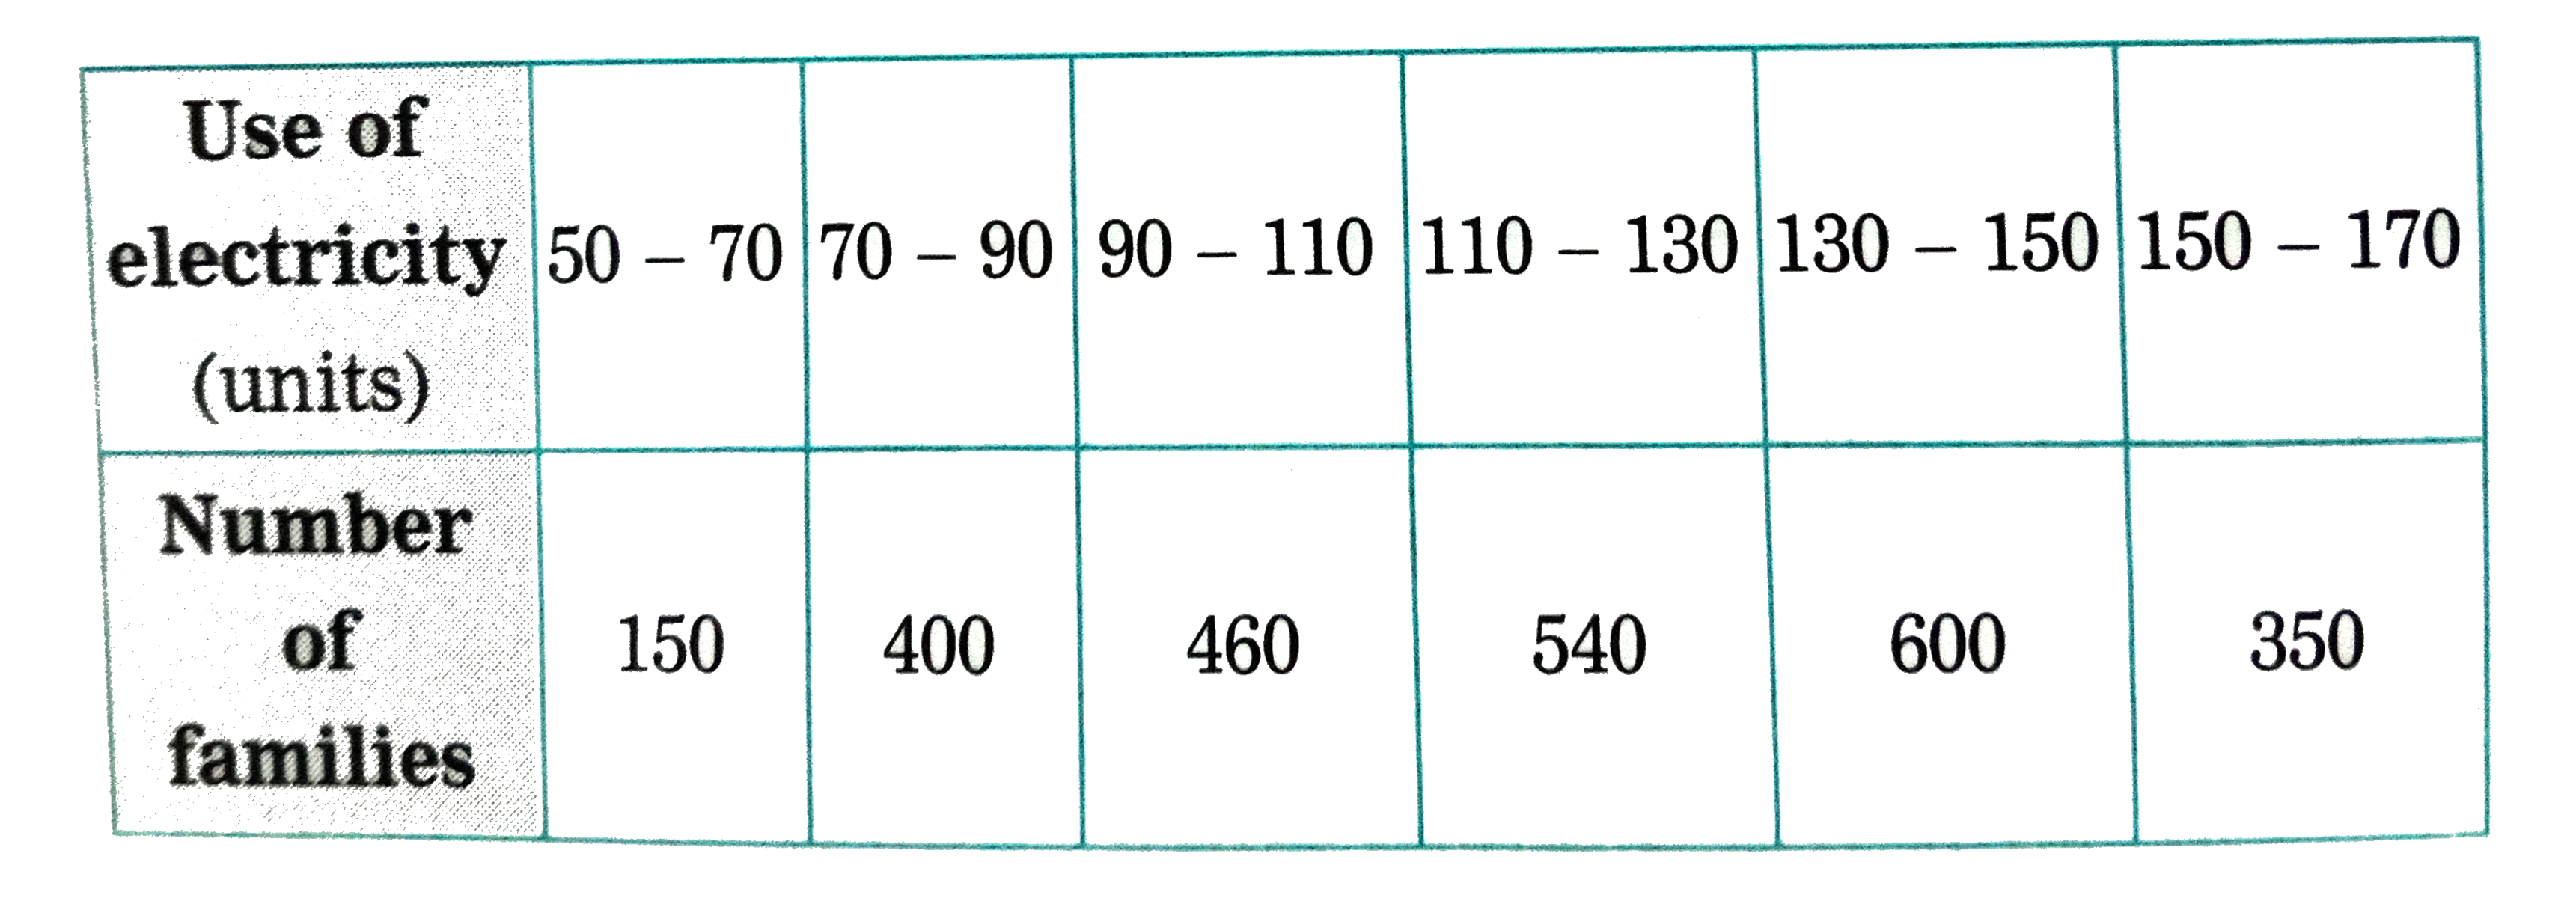
View SolutionDraw a histogram for the following frequency distribution.

View SolutionDraw the Histogram for the following frequency distribution.

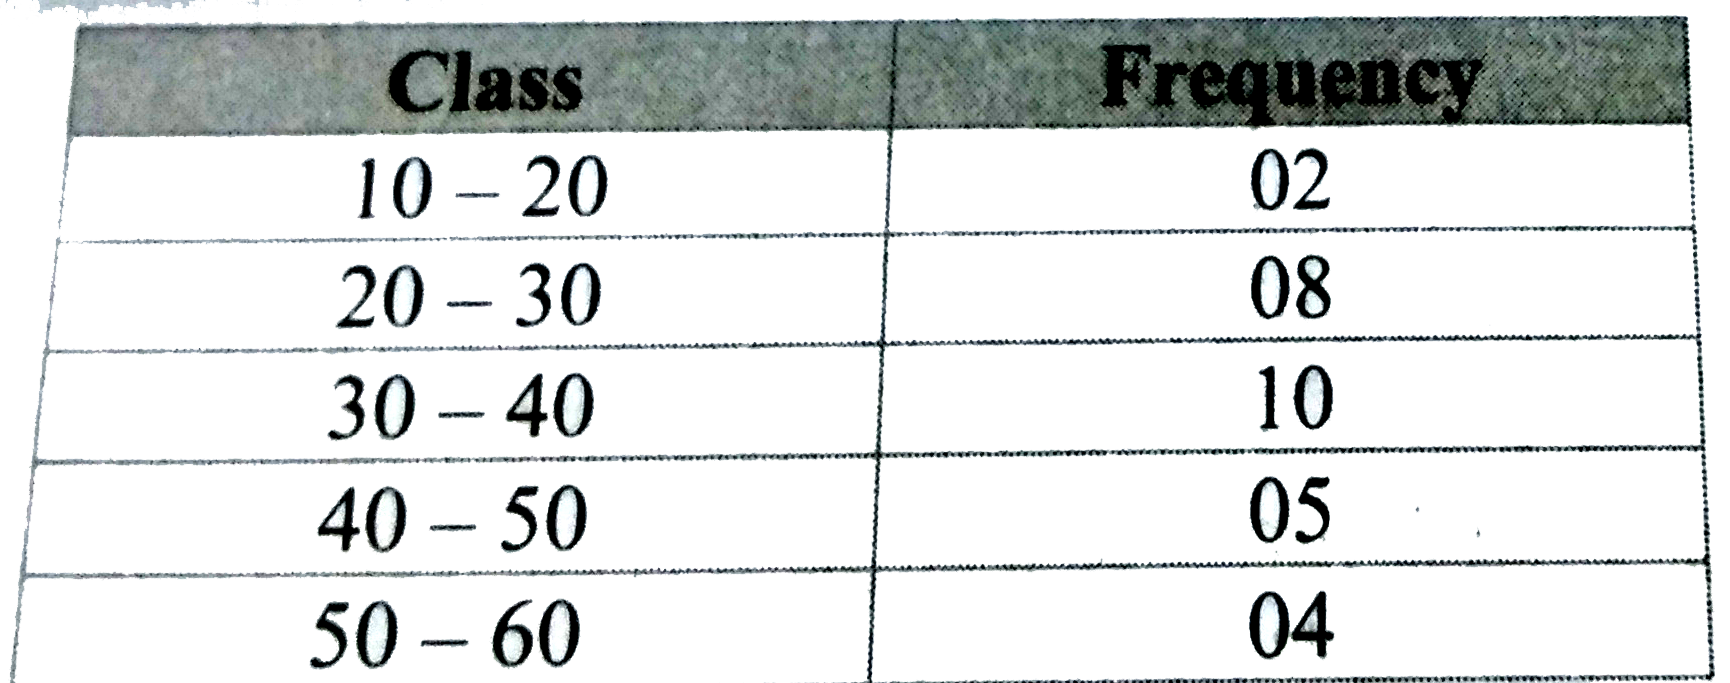
View SolutionDraw a frequency polygon for the following frequency distribution:

View SolutionDraw a frequency polygon for the following frequency distribution.

View SolutionDraw the histogram for the following frequency distribution :

View SolutionDraw a historgram for the following frequency distribution

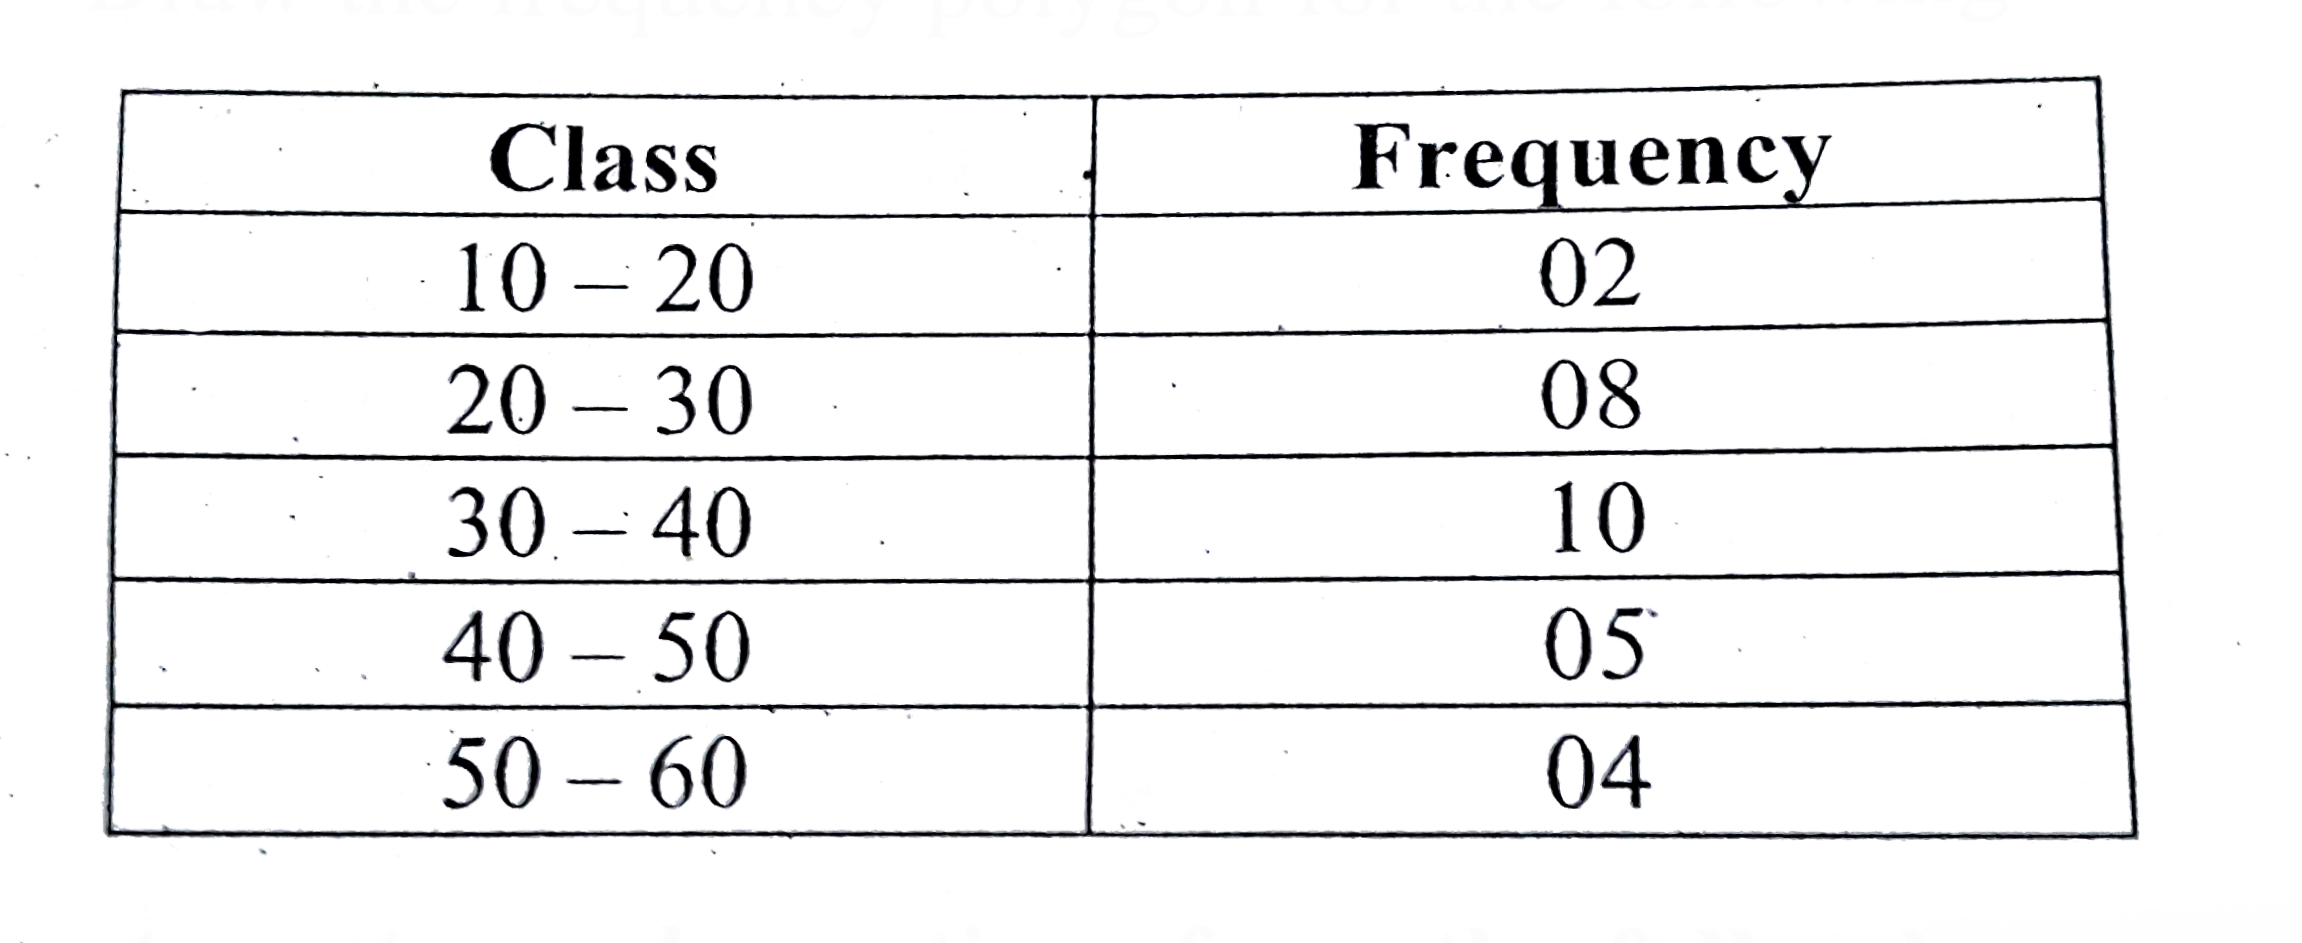
View SolutionDraw frequency polygon for the following frequency distribution.

View SolutionDraw the frequency polygon for the following frequency distribution:

View SolutionDraw an ogive to represent the following frequency distribution: Class-interval: 0-4 5-9 10-14 15-19 20-24 No. of students: 2 6 10 5 3
View Solution
