During the medical check-up of 35 students of a class, their weights were recorded as follows: Draw a less than type ogive for the given data. Hence obtain the median weight from the graph and verify the result by using the formula.
Step by step video & image solution for During the medical check-up of 35 students of a class, their weights were recorded as follows: Draw a less than type ogive for the given data. Hence obtain the median weight from the graph and verify the result by using the formula. by Maths experts to help you in doubts & scoring excellent marks in Class 10 exams.
Topper's Solved these Questions
- BOOK - OSWAL PUBLICATIONCHAPTER - STATISTICSEXERCISE - NCERT EXEMPLAR (Exercise - 14.1)11videos
STATISTICS
- BOOK - OSWAL PUBLICATIONCHAPTER - STATISTICSEXERCISE - NCERT EXEMPLAR (Exercise - 13.2)4videos
STATISTICS
- BOOK - OSWAL PUBLICATIONCHAPTER - STATISTICSEXERCISE - NCERT CORNER (Exercise - 14.3)7videos
STATISTICS
- BOOK - OSWAL PUBLICATIONCHAPTER - SOME APPLICATIONS OF TRIGONOMETRY (HEIGHTS AND DISTANCES) EXERCISE - CASE-BASED MCQs15videos
SOME APPLICATIONS OF TRIGONOMETRY (HEIGHTS AND DISTANCES)
- BOOK - OSWAL PUBLICATIONCHAPTER - SURFACE AREAS AND VOLUMES EXERCISE - BOARD CORNER (LONG ANSWER TYPE QUESTIONS)9videos
SURFACE AREAS AND VOLUMES
Similar Questions
During the medical checkup of 35 students of a class their weight were recorded as follows :

Draw a less than type a more than type ogive from the given data. Hene obtain the median weigth from the graph.View SolutionDraw a less than and more than median weight from the graph and type ogive for the given data. Hence find the verify the result by using the formula.
View Solution
Knowledge Check
- Question 1 - Select One
During a medical check-up, the heights of 40 students in a class were recorded as shown in the following table.

How many students have a height of 165 cm or more?A25B10C15D16
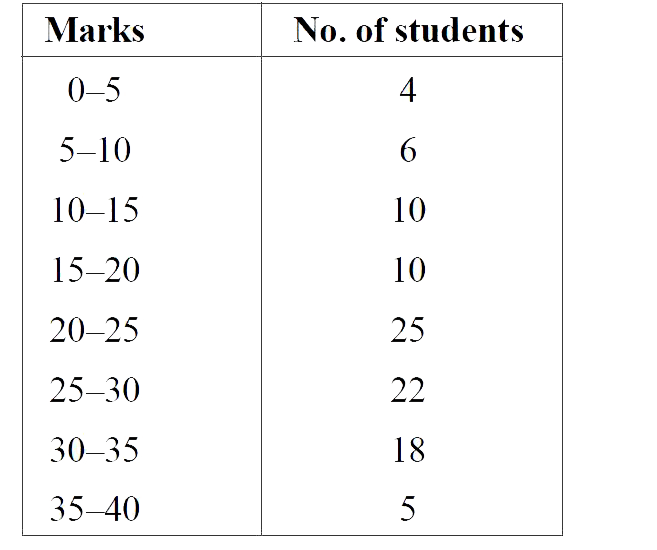
The distribution given below show the marks of 100 students of a class.

Draw a less than type and a more than type ogive from the given data. Hence obtain the median marks from the graph.View SolutionRefer to 0.4 above. Draw the less then type ogive for this data and use it to find the median weight.
View SolutionRefer to 0.5 above. Draw the less then type ogive for this data and use it to find the median weight.
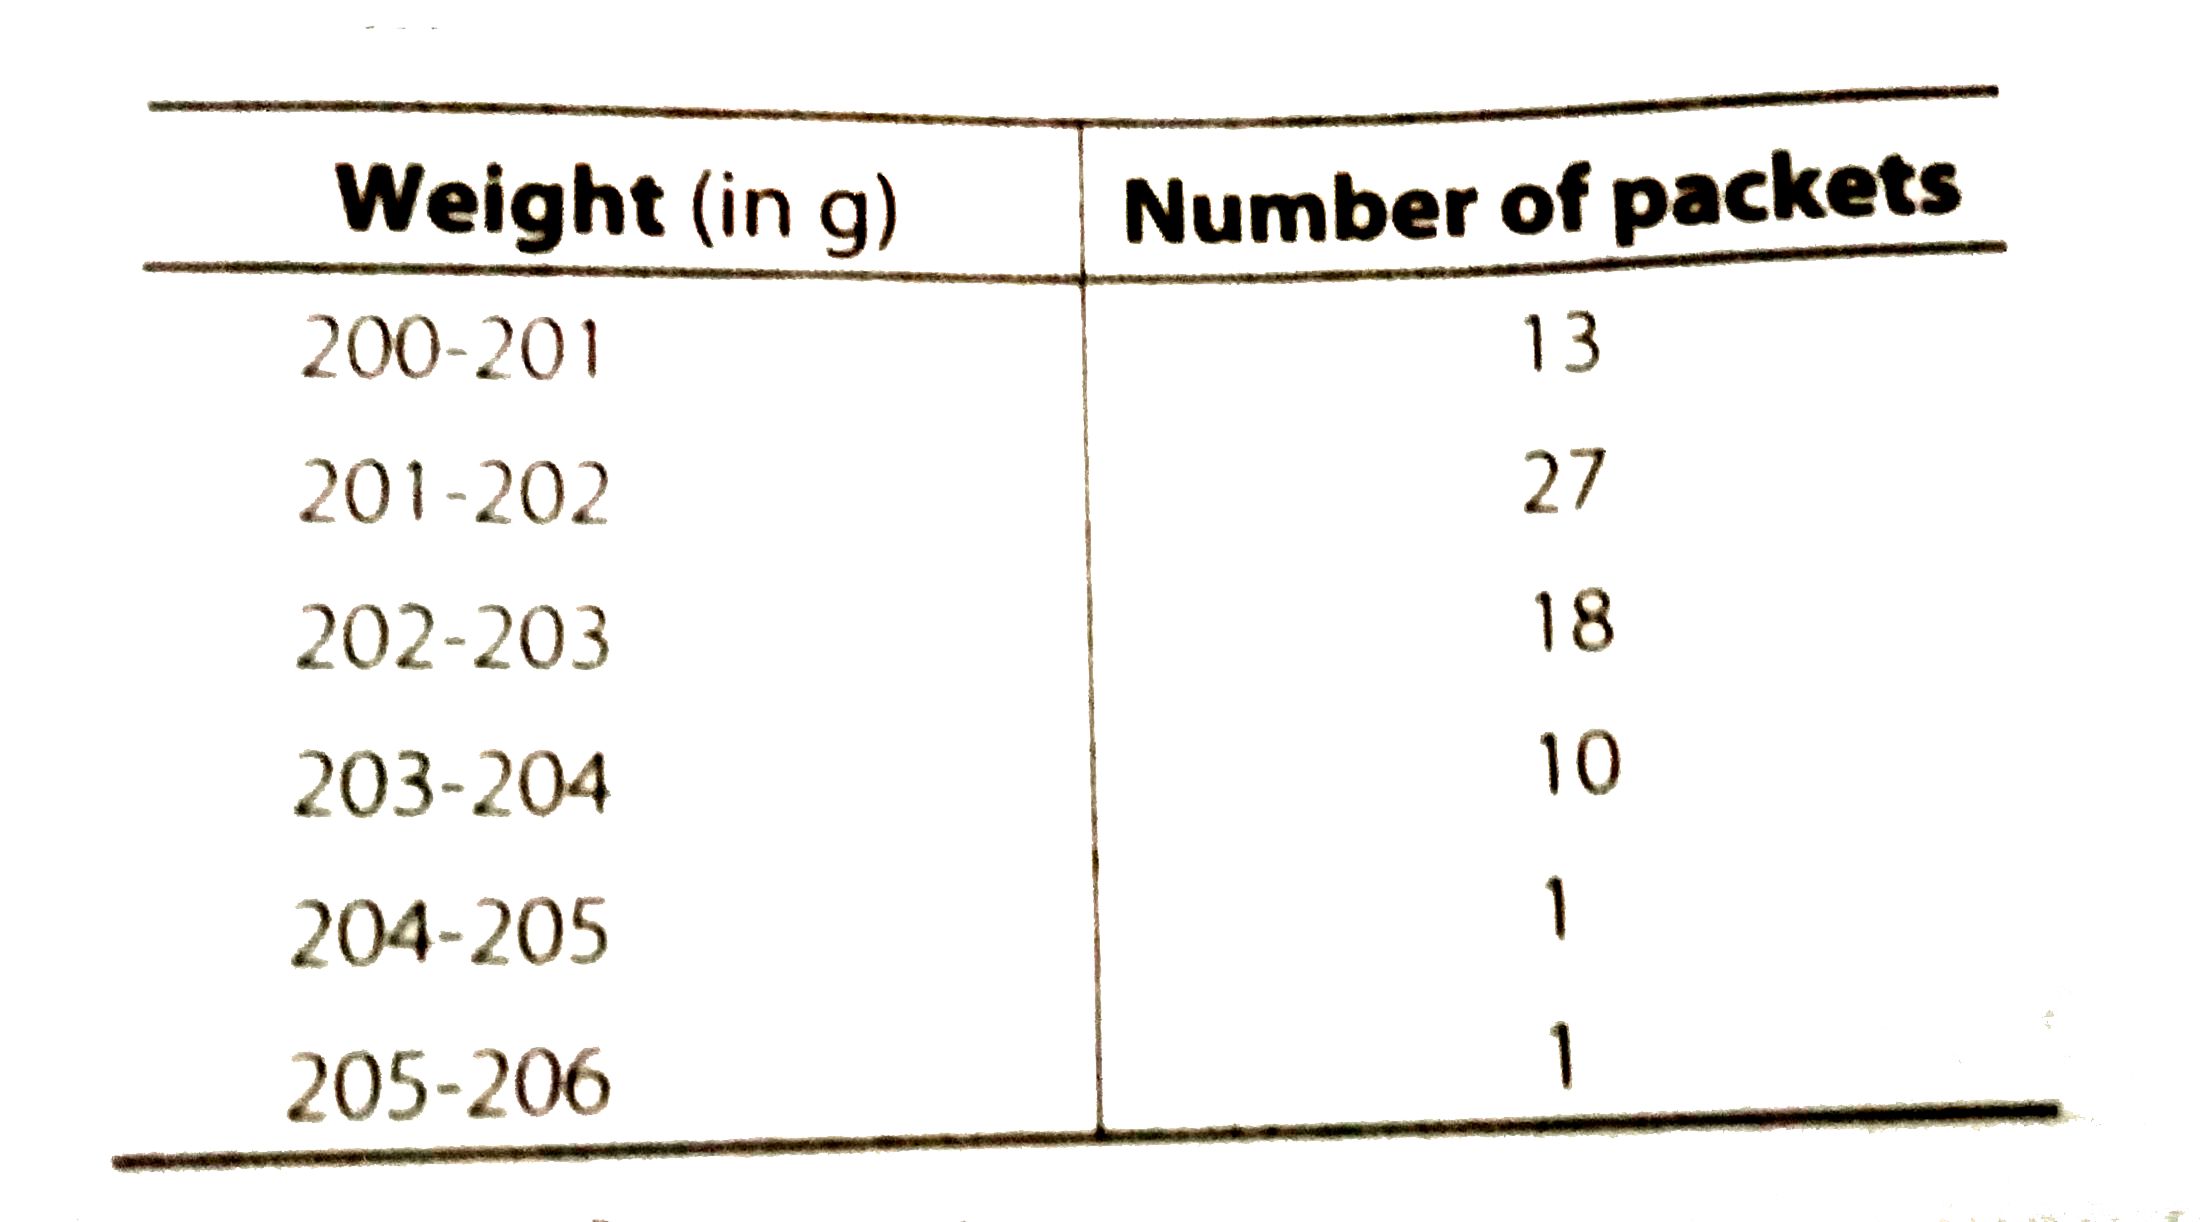
View SolutionThe weight of tea in 70 packets are shown in the following table

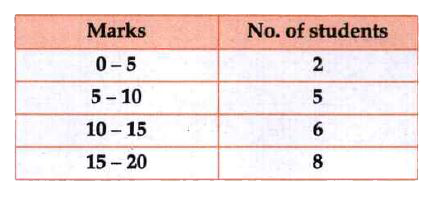
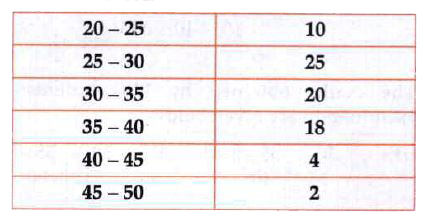
Find the mean weight of packets.View SolutionThe marks obtained by 100 students of class is an examination are given below:


Draw 'a less than' type cumulative frequency curves (ogive). Hence, find median.View SolutionFor the following data, draw a 'less than' ogive and hence find the median of the distribution.
 View Solution
for the following data, draw a less than ogive and hence find the median of the distribution.
View Solution

