Following table shows the monthly expenditure of Imran’s familyon various items.
To create a bar graph based on the monthly expenditure of Imran's family, we will follow these steps:
1. Collect Data: Gather the monthly expenditure data for Imran’s family on various items. For example, let's assume the data is as follows:
- House Rent: 3000
- Food: 4000
- Education: 2000
- Electricity: 800
- Transport: 1200
- Miscellaneous: 600
2. Decide the Scale: Choose a scale for the graph. In this case, we will represent 200 rupees as 1 unit length on the graph.
3. Calculate Unit Length for Each Item:
- House Rent: 3000200=15 units
- Food: 4000200=20 units
- Education: 2000200=10 units
- Electricity: 800200=4 units
- Transport: 1200200=6 units
- Miscellaneous: 600200=3 units
4. Draw Axes: Draw the X-axis (horizontal) and Y-axis (vertical) on a graph paper. Label the X-axis with the different expenditure categories (House Rent, Food, Education, Electricity, Transport, Miscellaneous) and the Y-axis with the expenditure amounts.
5. Draw Bars: For each category, draw a bar corresponding to the calculated unit lengths:
- House Rent: Draw a bar up to 15 units.
- Food: Draw a bar up to 20 units.
- Education: Draw a bar up to 10 units.
- Electricity: Draw a bar up to 4 units.
- Transport: Draw a bar up to 6 units.
- Miscellaneous: Draw a bar up to 3 units.
6. Label the Bars: Write the expenditure amounts at the top of each bar to indicate the exact amount spent on each category.
7. Final Touches: Ensure that all bars are of equal width and are spaced evenly. You can also add colors to each bar for better visual representation.
- House Rent: 3000
- Food: 4000
- Education: 2000
- Electricity: 800
- Transport: 1200
- Miscellaneous: 600
- House Rent: 3000200=15 units
- Food: 4000200=20 units
- Education: 2000200=10 units
- Electricity: 800200=4 units
- Transport: 1200200=6 units
- Miscellaneous: 600200=3 units
- House Rent: Draw a bar up to 15 units.
- Food: Draw a bar up to 20 units.
- Education: Draw a bar up to 10 units.
- Electricity: Draw a bar up to 4 units.
- Transport: Draw a bar up to 6 units.
- Miscellaneous: Draw a bar up to 3 units.
Topper's Solved these Questions
- DATA HANDLINGBOOK - NCERTCHAPTER - DATA HANDLINGEXERCISE - EXERCISE 9.3
3 Videos
- DATA HANDLINGBOOK - NCERTCHAPTER - DATA HANDLINGEXERCISE - EXERCISE 9.4
4 Videos
- DATA HANDLINGBOOK - NCERTCHAPTER - DATA HANDLINGEXERCISE - EXERCISE 9.1
7 Videos
- BASIC GEOMETRICAL IDEASBOOK - NCERTCHAPTER - BASIC GEOMETRICAL IDEASEXERCISE - EXERCISE 4.6
4 Videos
- DECIMALSBOOK - NCERTCHAPTER - DECIMALSEXERCISE - EXERCISE 8.1
10 Videos
Similar Questions
Following table shows the monthly expenditure of Imran’s familyon various items.
View SolutionThe following pie-chart shows the monthly expenditure of a man on various items. If he spends Rs. 16,000 per month, answer the following questions.
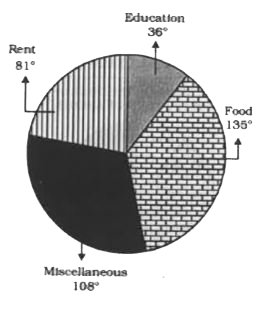
If miscellaneous expenses be x% of the total expense, then value of x is:
View Solution
Knowledge Check
The following pie-chart shows the monthly expenditure of a family on various items. If the family spends Rs. 825 on clothing, answer the question
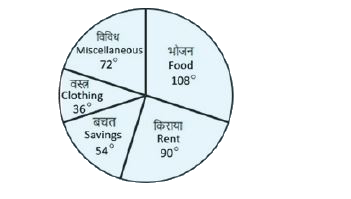
What is the total monthly income of the family?ARs. 8025BRs. 8250CRs. 8520DRs. 8052The following pie-chart shows the monthly expenditure of a family on various items. If the family spends Rs. 825 on clothing, answer the question
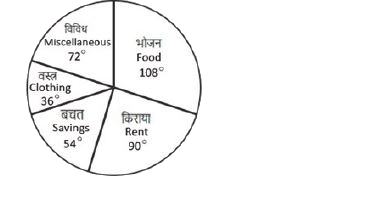
What percent of the total income does the family save ?A0.15B0.5C0.2D0.25The following pie-chart shows the monthly expenditure of a family on various items. If the family spends Rs. 825 on clothing, answer the question
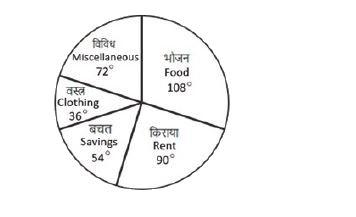
What is the average of expenses on clothing and rent?ARs. 1443.75BRs. 1344.57CRs. 1574.34DRs. 1734.45
The following pie-chart shows the monthly expenditure of a man on various items. If he spends Rs. 16,000 per month, answer the following questions.
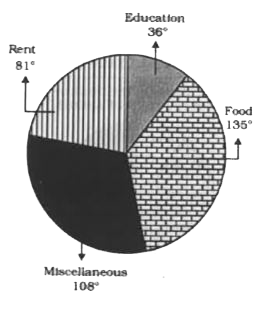
The ratio of expenses on food and rent is :
View SolutionThe following pie-chart shows the monthly expenditure of a man on various items. If he spends Rs. 16,000 per month, answer the following questions.
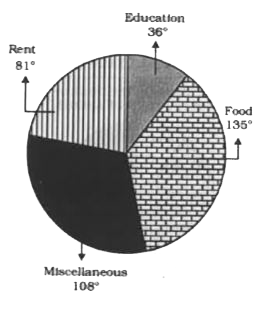
The amount he spends on education is:
View SolutionThe following pie-chart shows the monthly expenditure of a man on various items. If he spends Rs. 16,000 per month, answer the following questions.
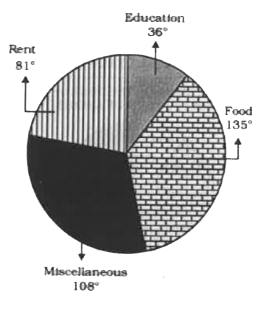
How much more does he spend on rent as compared to education ?
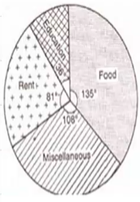
View SolutionThe following pie-chart shows the monthly expenditure of Shikha on various items. If she spends Rs. 16000 per month, answer the following questions: How much does she spend on rent? How much does she spend on education? What is the ratio of expenses on food and rent?
View SolutionThe following table shows the monthly expenditure of different families on different items :

Represent the data in the form of a sub-divided bar diagram.
View Solution
