Following table shows the points of each player scored in four games

Now answer the following questions
Who is the best performer ?
The correct Answer is:A is the best performer anong these three
Step by step video, text & image solution for Following table shows the points of each player scored in four games Now answer the following questions Who is the best performer ? by Maths experts to help you in doubts & scoring excellent marks in Class 7 exams.
Updated on:21/07/2023Topper's Solved these Questions
- DATA HANDLINGBOOK - MTG IIT JEE FOUNDATIONCHAPTER - DATA HANDLINGEXERCISE - NCERT Section (Exercise - 3 .2 )
9 Videos
- DATA HANDLINGBOOK - MTG IIT JEE FOUNDATIONCHAPTER - DATA HANDLINGEXERCISE - NCERT Section (Exercise - 3 .3 )
19 Videos
- DATA HANDLINGBOOK - MTG IIT JEE FOUNDATIONCHAPTER - DATA HANDLINGEXERCISE - Solved Examples
30 Videos
- CONGRUENCE OF TRIANGLES BOOK - MTG IIT JEE FOUNDATIONCHAPTER - CONGRUENCE OF TRIANGLES EXERCISE - Olympiad/HOTS Corner
10 Videos
- EXPONENTS AND POWERSBOOK - MTG IIT JEE FOUNDATIONCHAPTER - EXPONENTS AND POWERSEXERCISE - OLYMPIAD/HOTS CORNER
15 Videos
Similar Questions
Following table shows the points of each player scored in four games

Now answer the following questions
To find the mean number of points per game for C, would you divide the total points by 3 or by 4 ? why ?
View SolutionFollowing table shows the points of each player scored in four games:Now answer the following questions:(i) Find the mean to determine A’s average number of points scored per game.(ii) To find the mean number of points per game for C, would you divide the totalpoints by 3 or by 4? Why?(iii) B played in all the four games. How would you find the mean?(iv) Who is the best performer?
View Solution
Knowledge Check
Who of the following rulers had performed four Aswamedham?
APushyamitra SunghaBPravarasena ICSamudraguptaDChandragupta IIThe pie charts shows the results of an online survey which asked people about their favourite game. Study the diagram and answer the following questions. Find percentage people who say their favorite game is Cricket and Hockey of the total people?
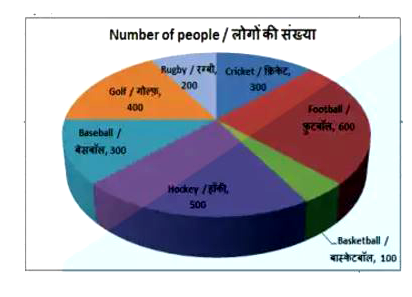
A0.3B33.33C0.25D32.34The pie chart shows the results of an online survey which asked people about their favourite game. Study the diagram and answer the following questions.
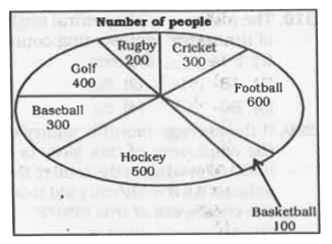
Respondents who say their favourite game is Cricket and those who say their favourite game is Hockey constitute what per cent of the total respendents?A0.3B0.3333C0.25D0.4
Following table shows the points of each player scored in four games
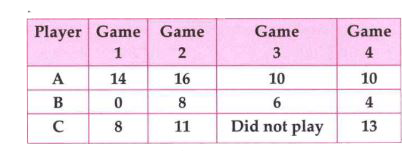
Now answer the following questions
Find the mean to determine A' s average number of points scored per game
View SolutionFollowing table shows the points of each player scored in four games

Now answer the following questions
B played in all the four games. How would your find the mean ?
View SolutionDirection: The following table shows the data of people of five different cities. Study the following table and answer the following questions.
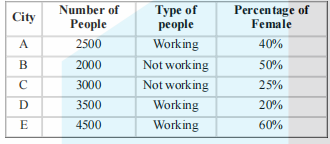
The total number of males who are working out of five cities is-
View SolutionPerformance based graph) The given graph shows the total runs scored by two batmans P and Q during each of the five different matches in the year 2011. study the graph and answer the following questions :
Which line shows the runs scored by batmans Q?
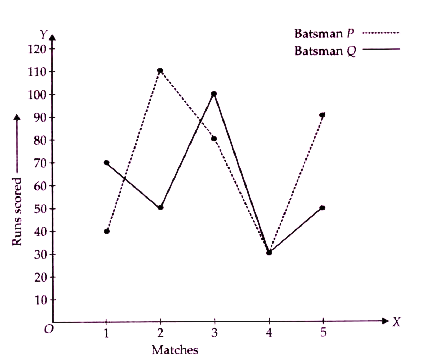
View SolutionPerformance based graph) The given graph shows the total runs scored by two batmans P and Q during each of the five different matches in the year 2011. study the graph and answer the following questions :
Were the run scored by them same in any match in 2011? if so, in which match? .
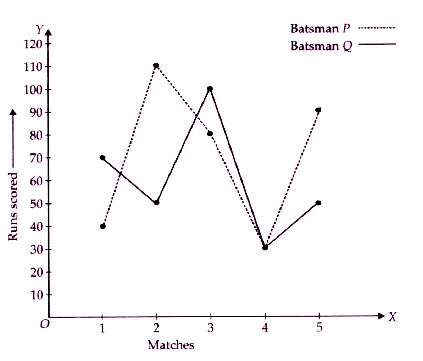
View Solution
