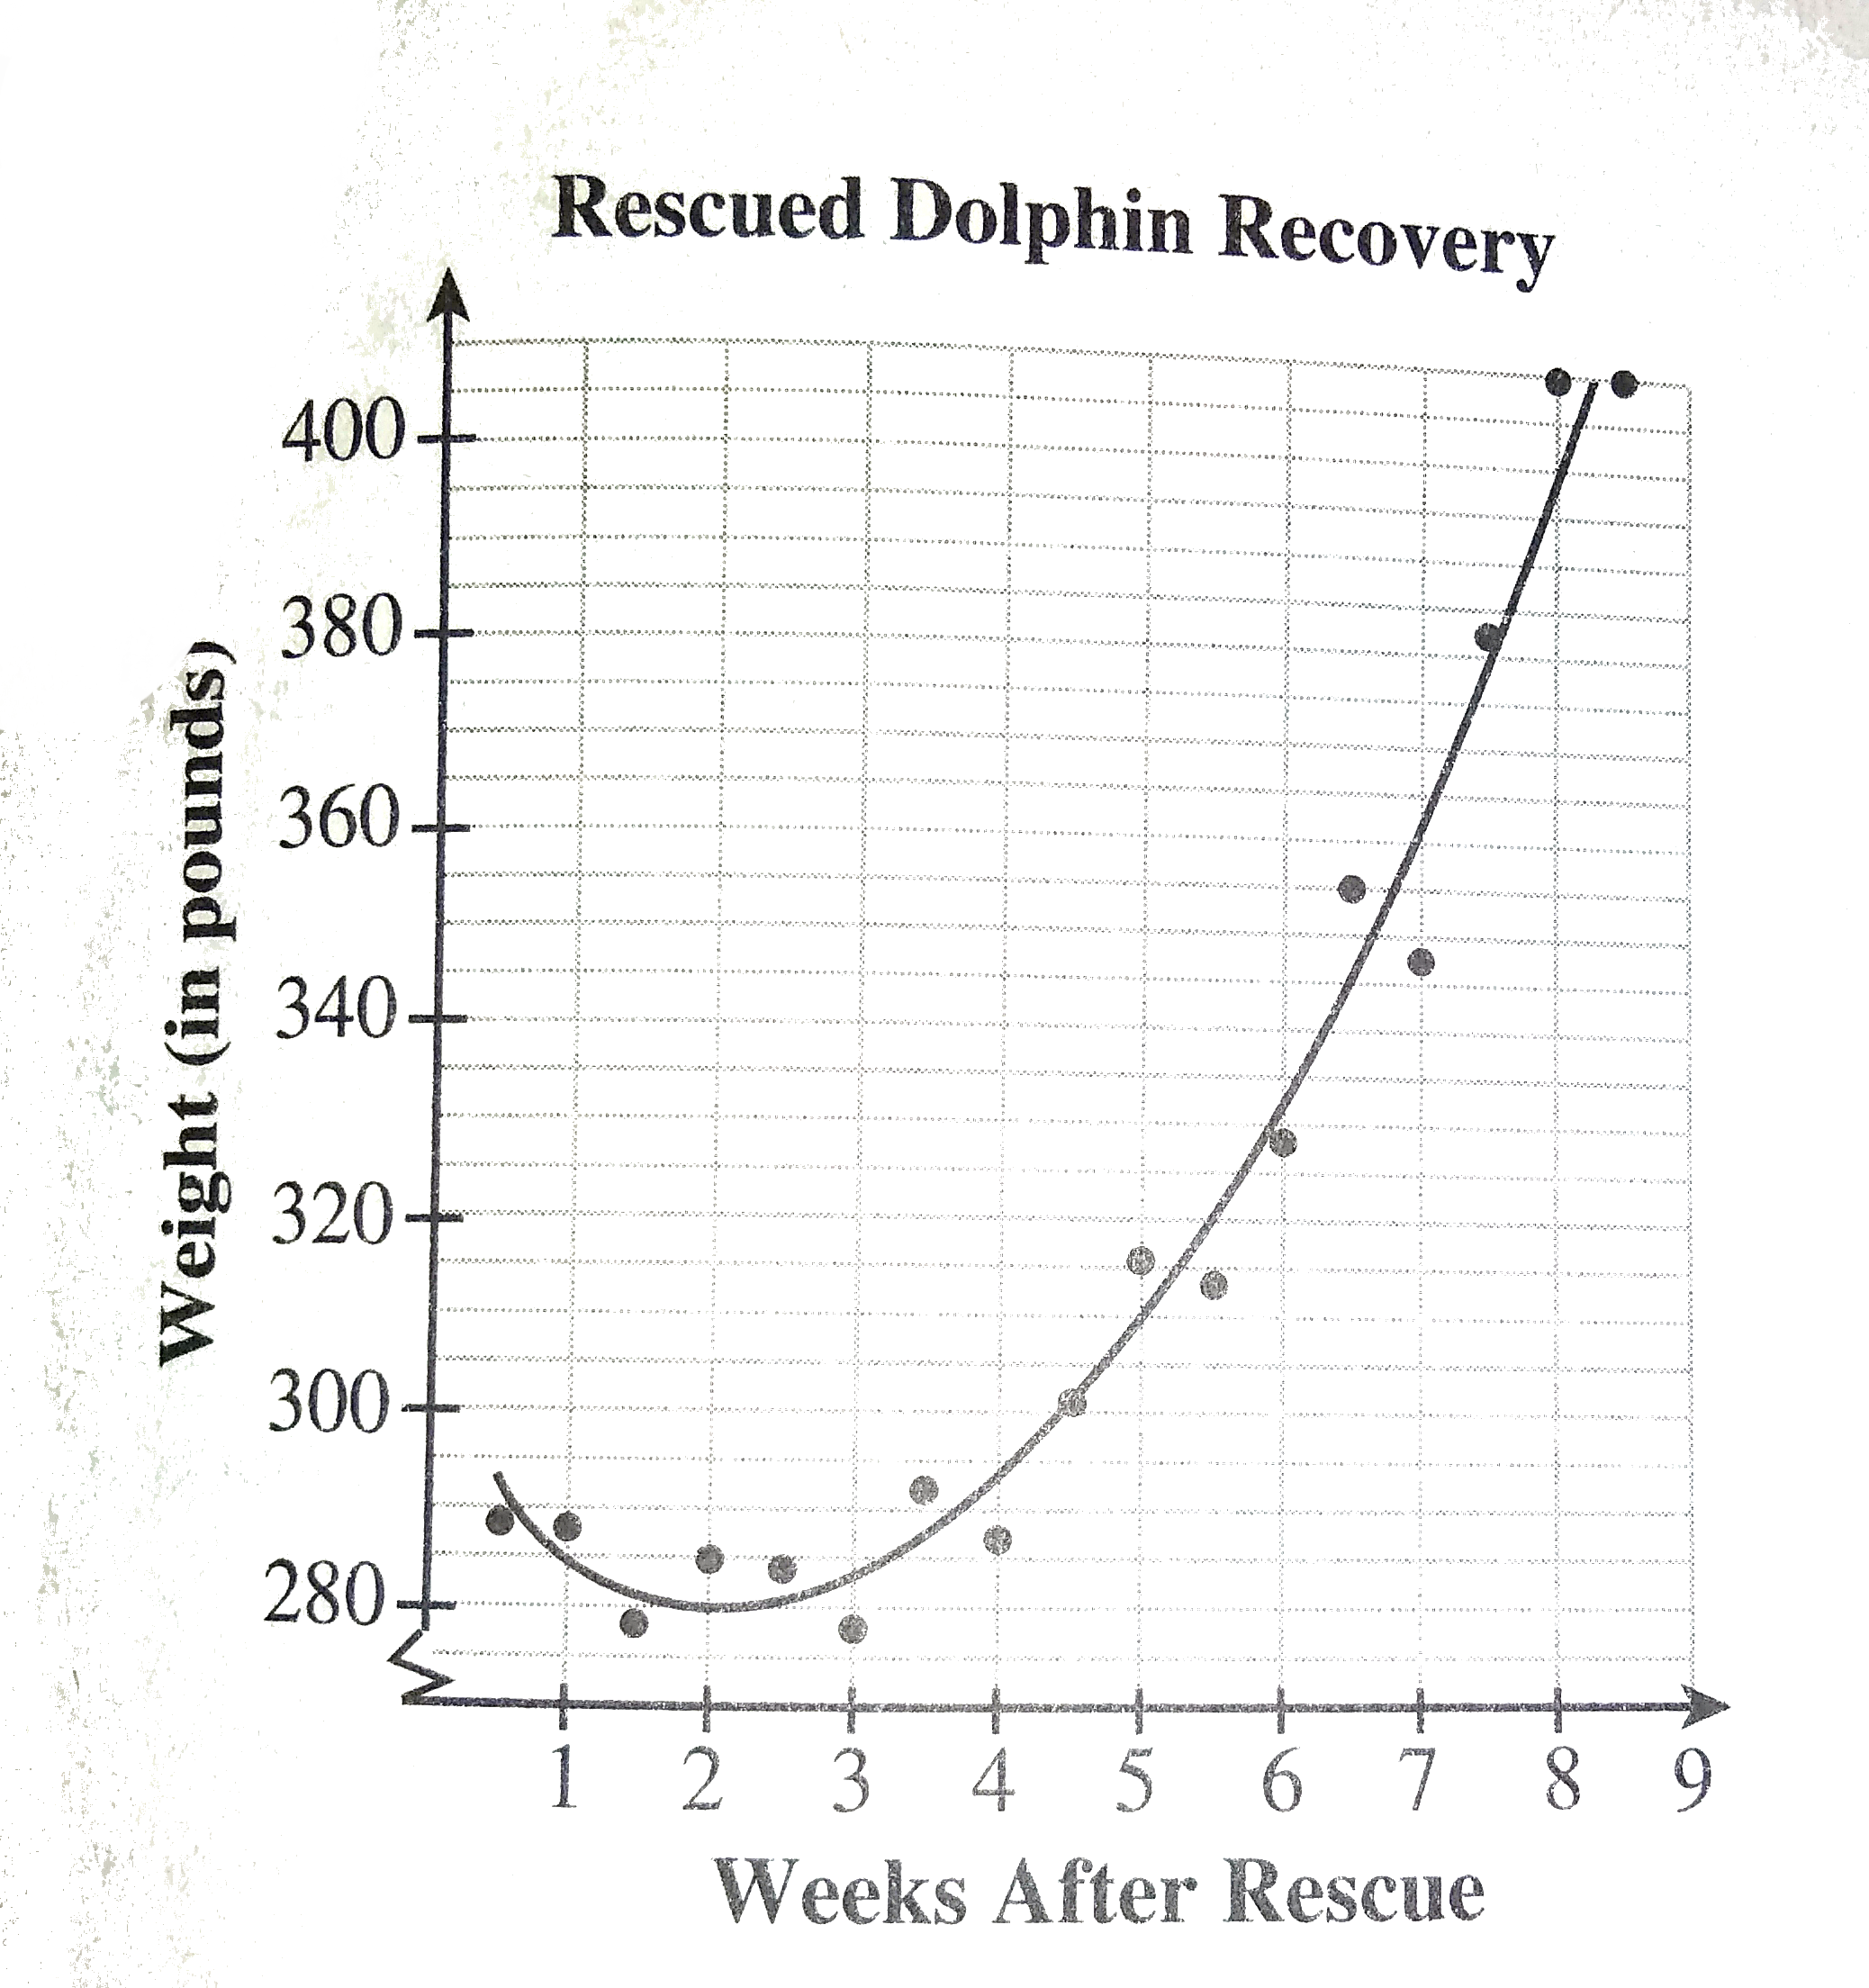
Following the catastrophic oil spill in the Gulf of Mexico in April of 2010, more than 900 bottlenose dolphins were found dead or stranard in the oil spill area. The figure above shows the weight of a recued dolphin during its recovery. Based on the quadratic model fit to the data shown, which of the following is the closest to the average rate of change in the dolphin's weight between week 2 and week 8 of its recovery?
4 pounds per week
16 pounds per week
20 pounds per week
40 pounds per week
The correct Answer is:C
Step by step video & image solution for Following the catastrophic oil spill in the Gulf of Mexico in April of 2010, more than 900 bottlenose dolphins were found dead or stranard in the oil spill area. The figure above shows the weight of a recued dolphin during its recovery. Based on the quadratic model fit to the data shown, which of the following is the closest to the average rate of change in the dolphin's weight between week 2 and week 8 of its recovery? by Maths experts to help you in doubts & scoring excellent marks in Class 10 exams.
Updated on:21/07/2023Topper's Solved these Questions
Similar Questions
Knowledge Check
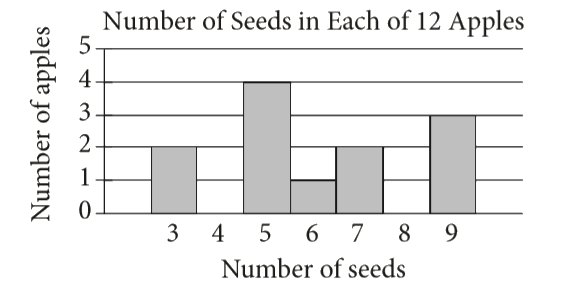
Based on the histogram above, of the following, which is closest to the average (arithmetic mean) number of seeds per apple?A4B5C6D7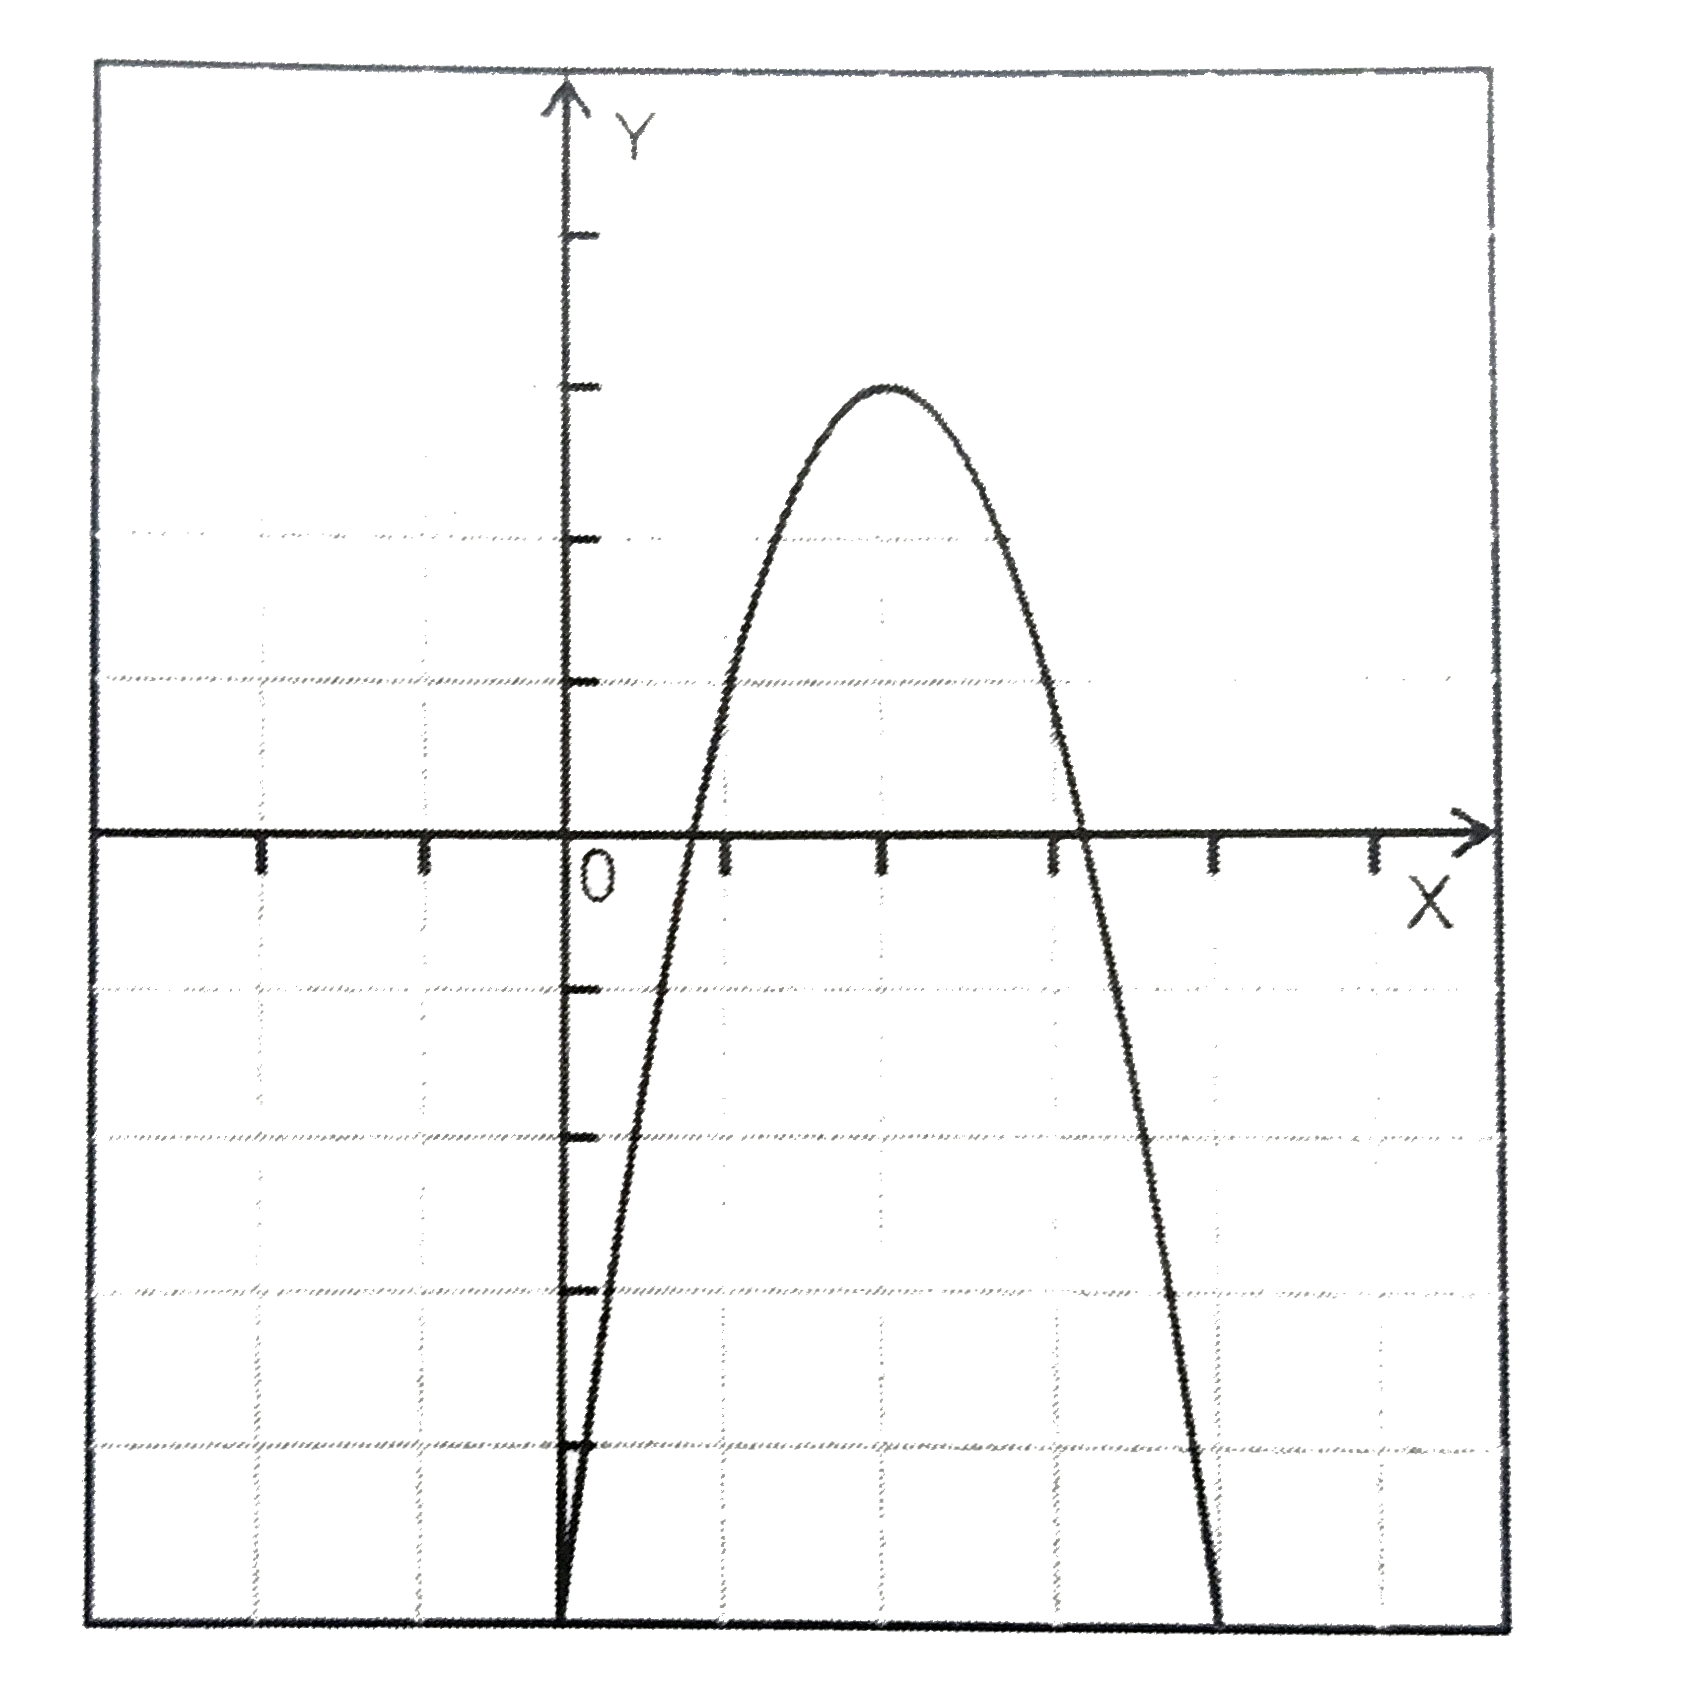
Which of the following can be the correct expression for the graph of the quadratic shown above ?Ay=x2−6x+8By=−x2+6x−8Cy=x2+6x−8Dy=−x2+6x+8
Which of the following is constituent of oil of wintergreen ?
View SolutionWhich of the following ethers is presents in clove oil ?
View SolutionHofmann mustard oil reaction.
View Solution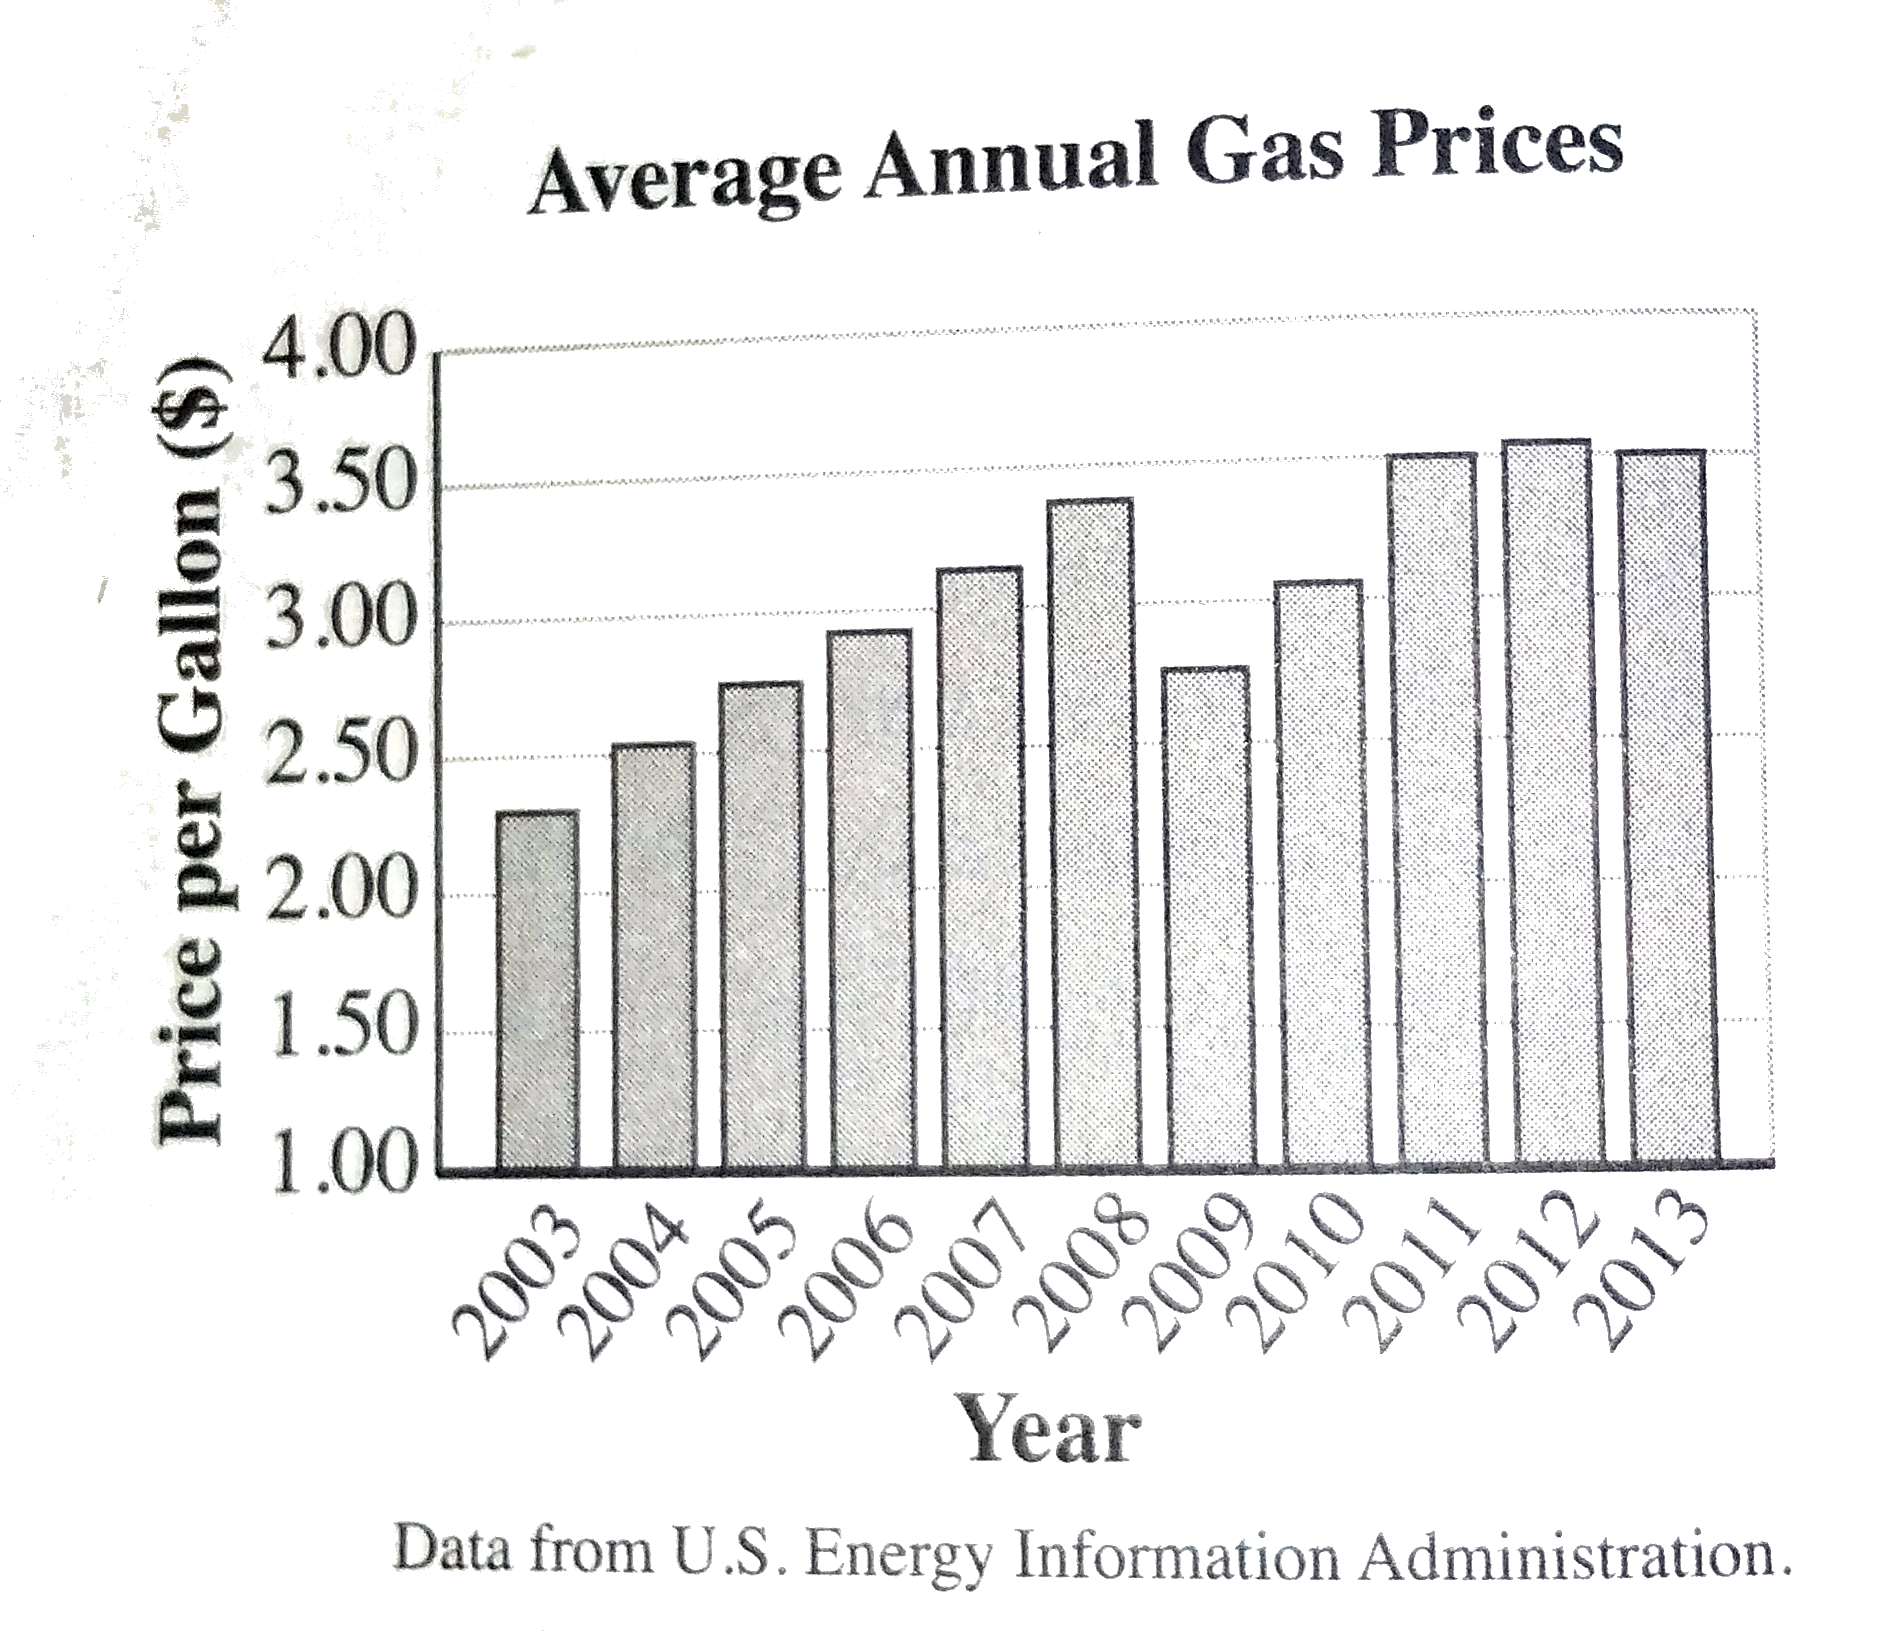
The figure above shows the average annual gas prices in the United States from 2003 to 2013. Based on the information shown, which of the following conclusions is valid?
View SolutionWhich of the following undergoes mustard oil reaction ?
View Solution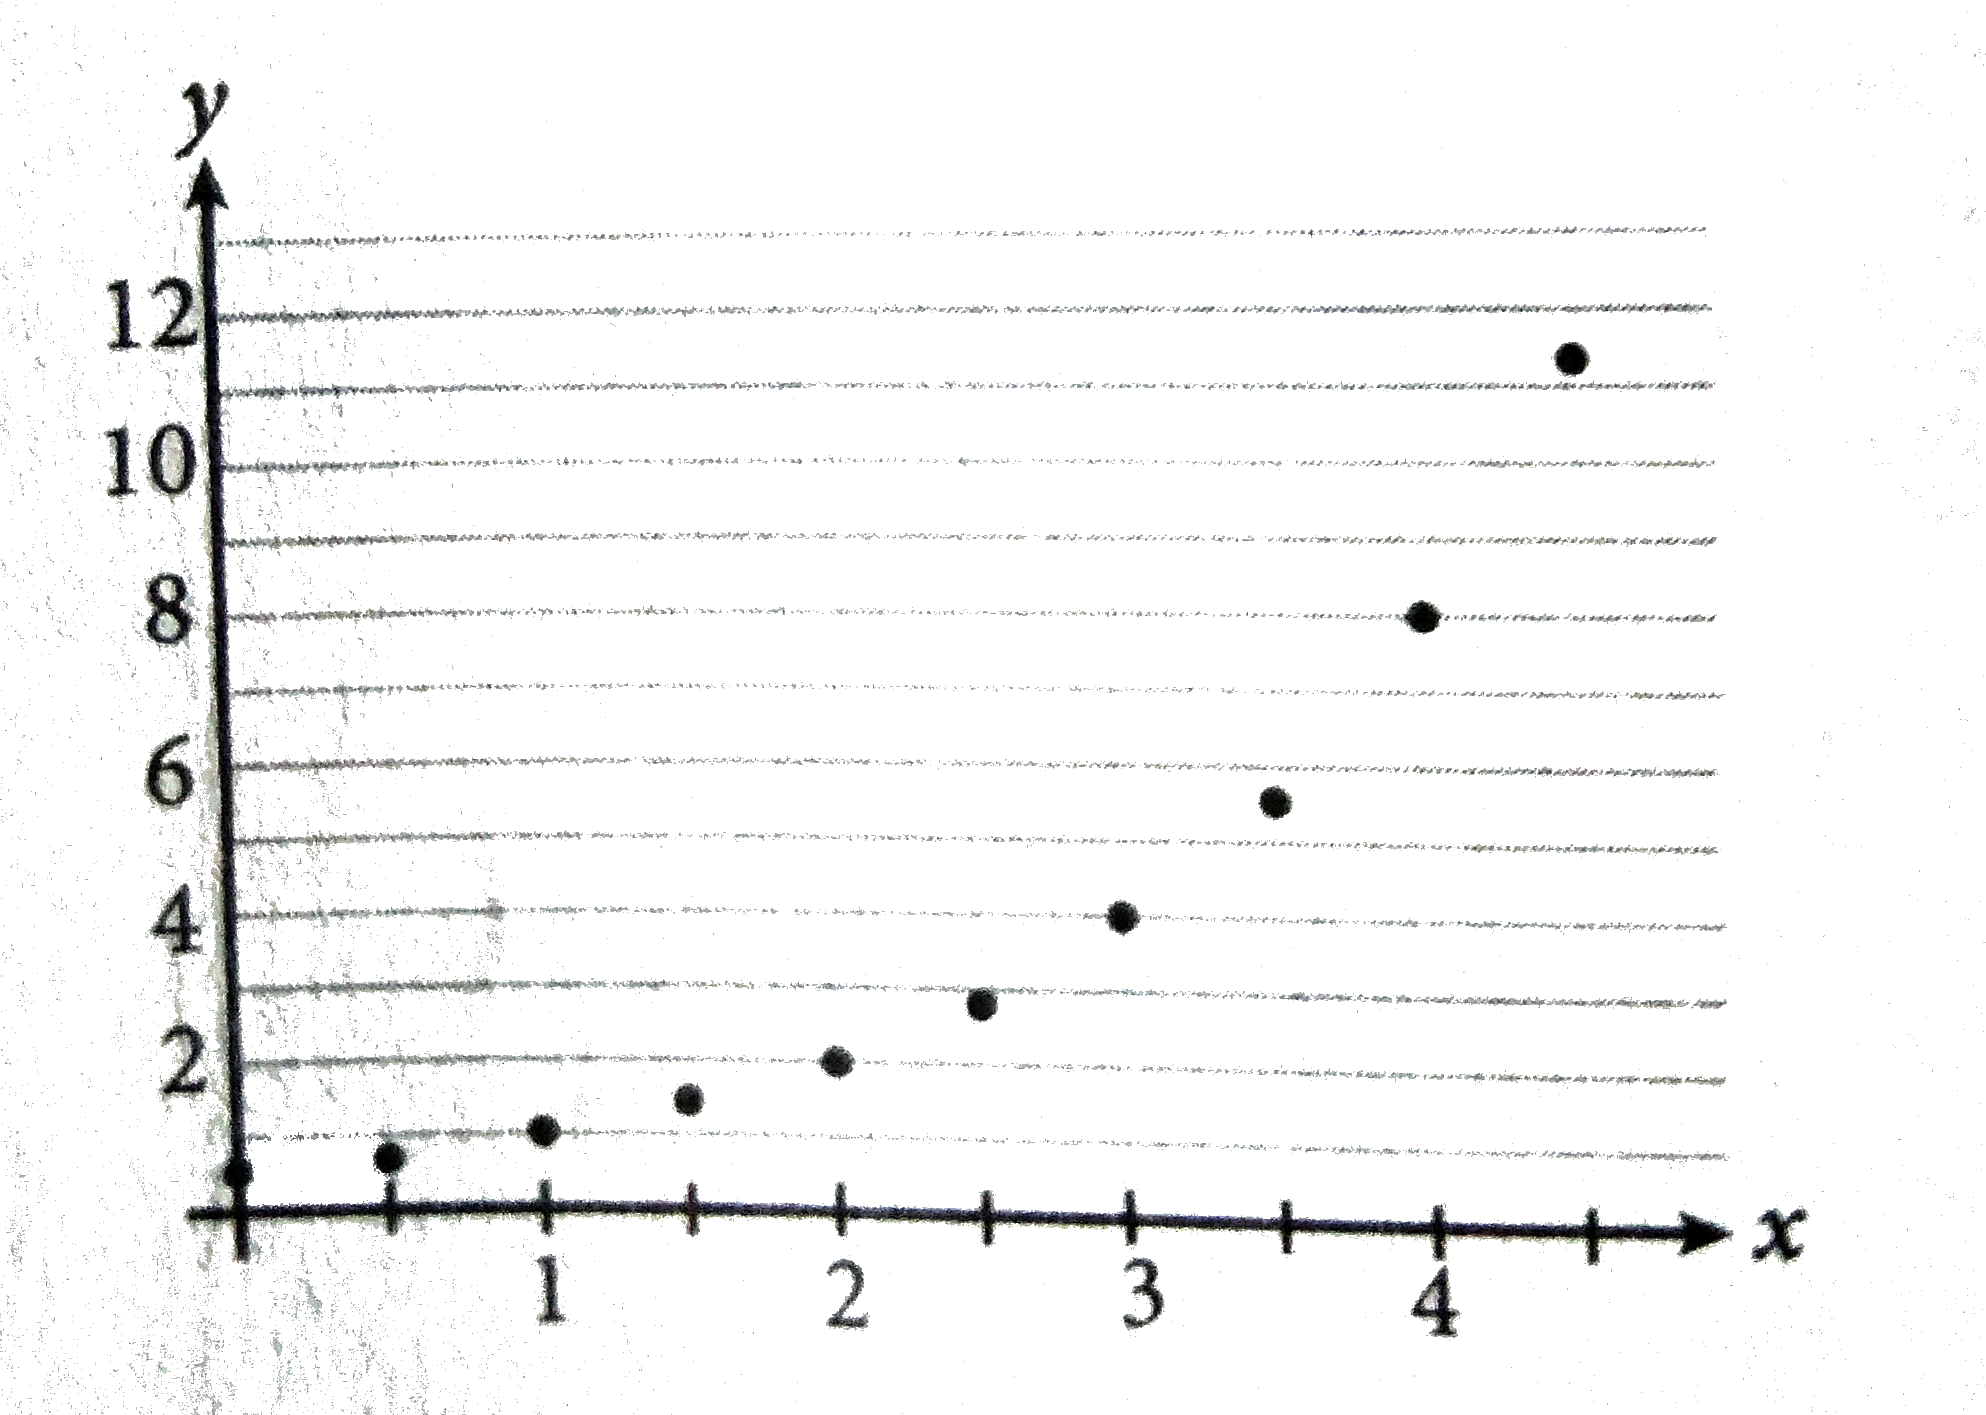
Which of the following equations best models the data shown in the scatterplot above?
View Solution
