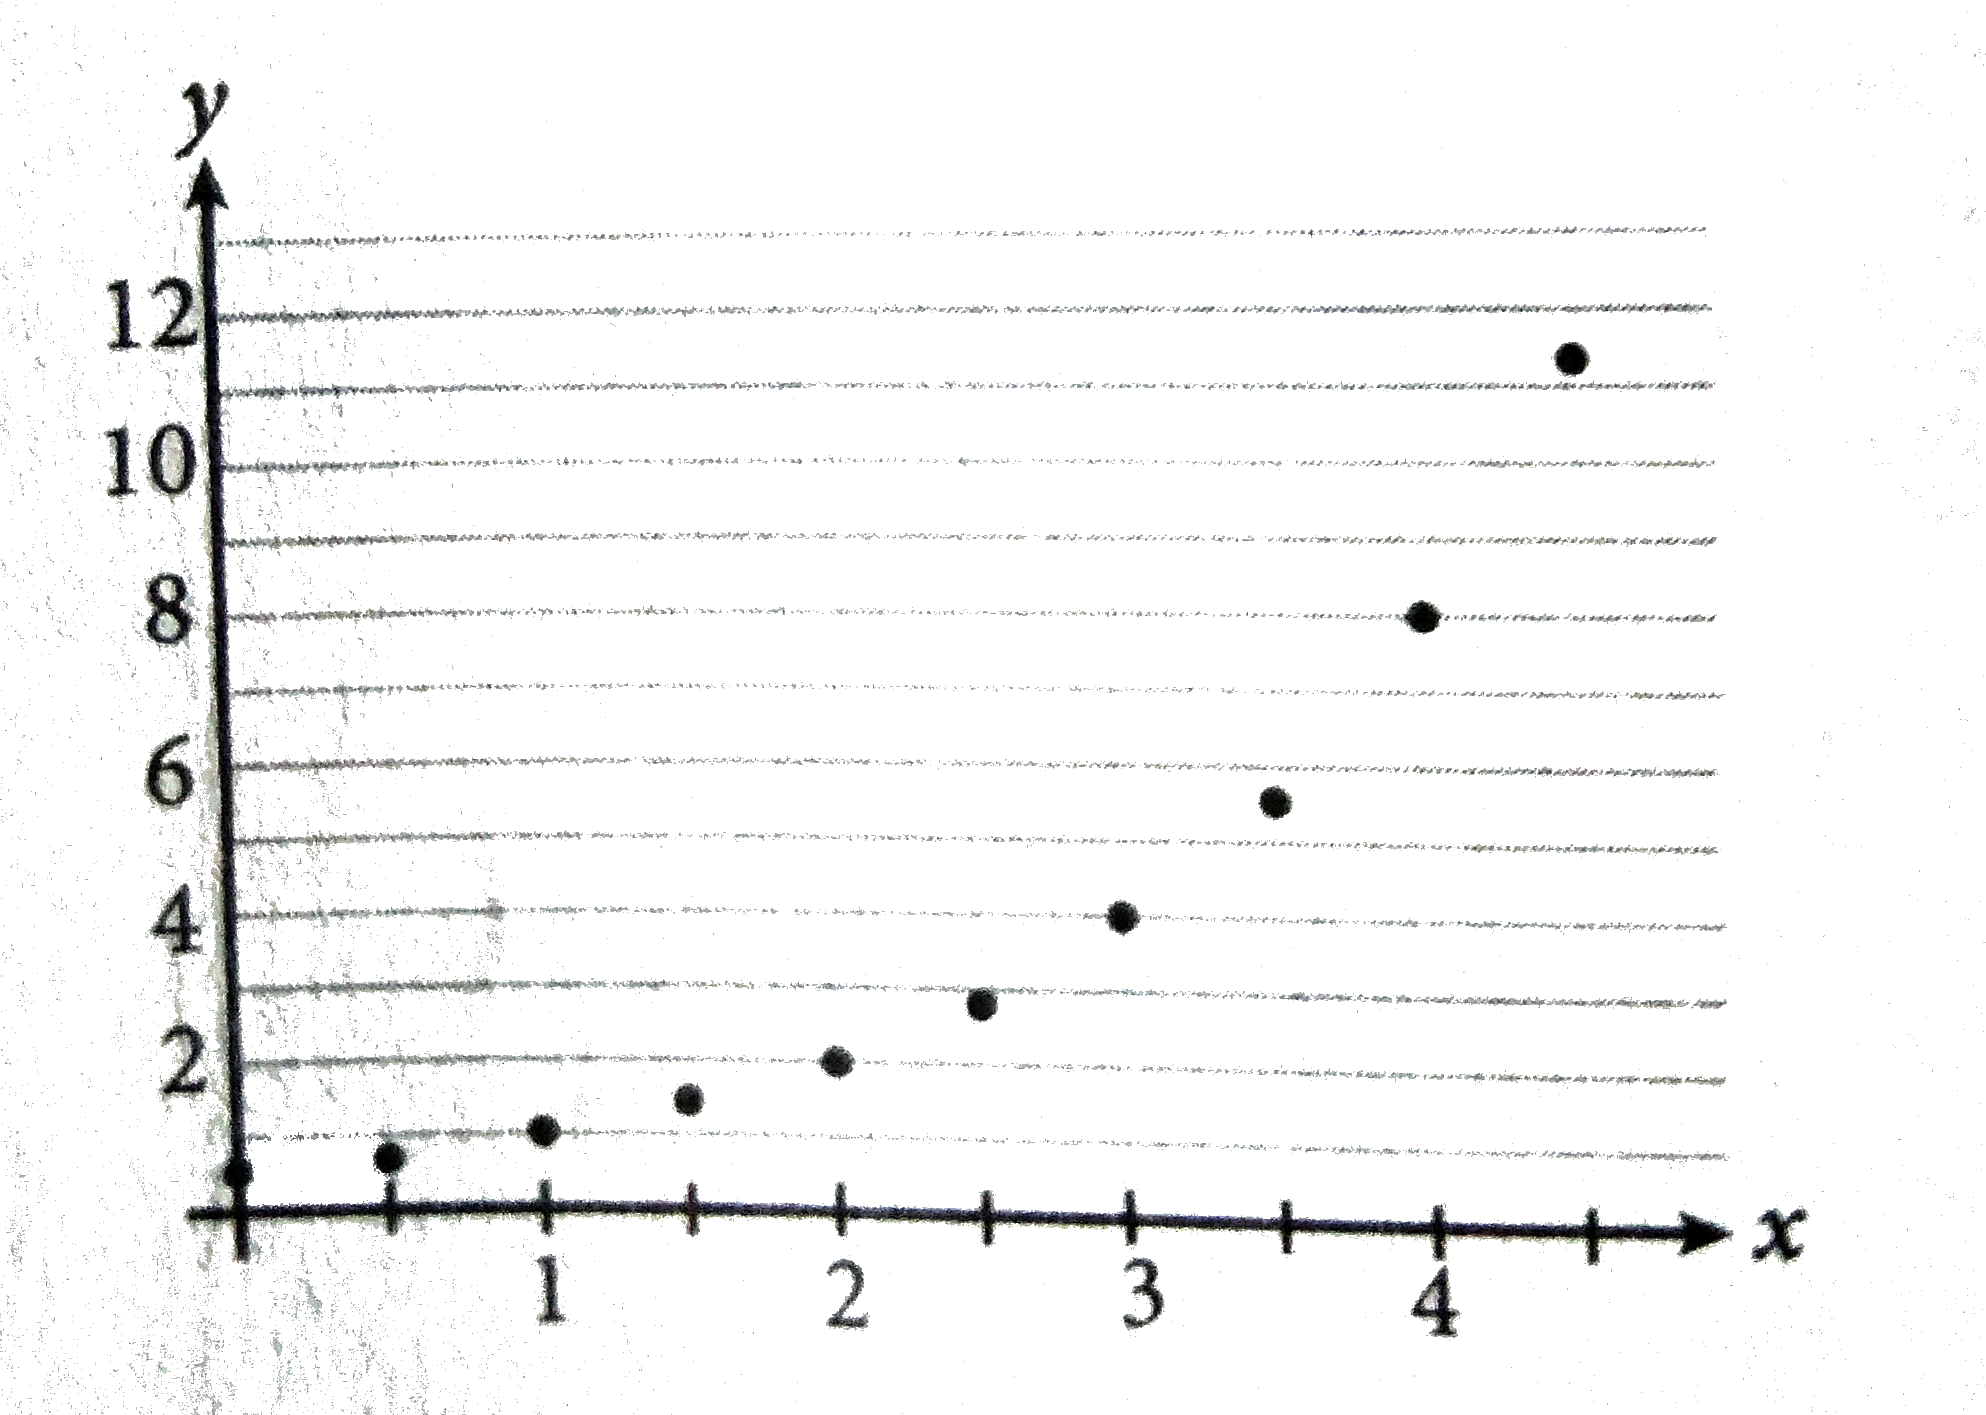
Which of the following equations best models the data shown in the scatterplot above?
A
y=12x
B
y=(12)x
C
y=12(2x)
D
y=32x−1
Video Solution
Text Solution
The correct Answer is:C
Difficult: Medium
Category: Problem Solving and Data Analysis/ Scatterplots
Strategic Advice: Whenever you need to match data to a model, use the trend (shape) of the data to determine the type of model (linear, exponential, quadratic, or polynomial), and then use specific data points (if needed) to identify the best choice.
Getting to the Answer: The trend of the data shown in the scatterplot is increasing, slowly at first and then much more quickly, which indicates an exponential model. This means you can eliminate A and D (both are linear). To choose between B and (C), choose a data point (preferably one that lies on a grib-line and represents whole number values) and test it in each answer choice. Avoid x=0 and x=1 because those numbers habe special properties when exponential are involved. Using the point (3, 4), the result are:
y=(12)x→(12)3=12×12×12=14≠4
Eliminate B, making (C) the correct choices. If you're still unsure, you can check (C):
y=12⋅2x→12⋅23=12⋅8=4
|
Topper's Solved these Questions
Similar Questions
Knowledge Check
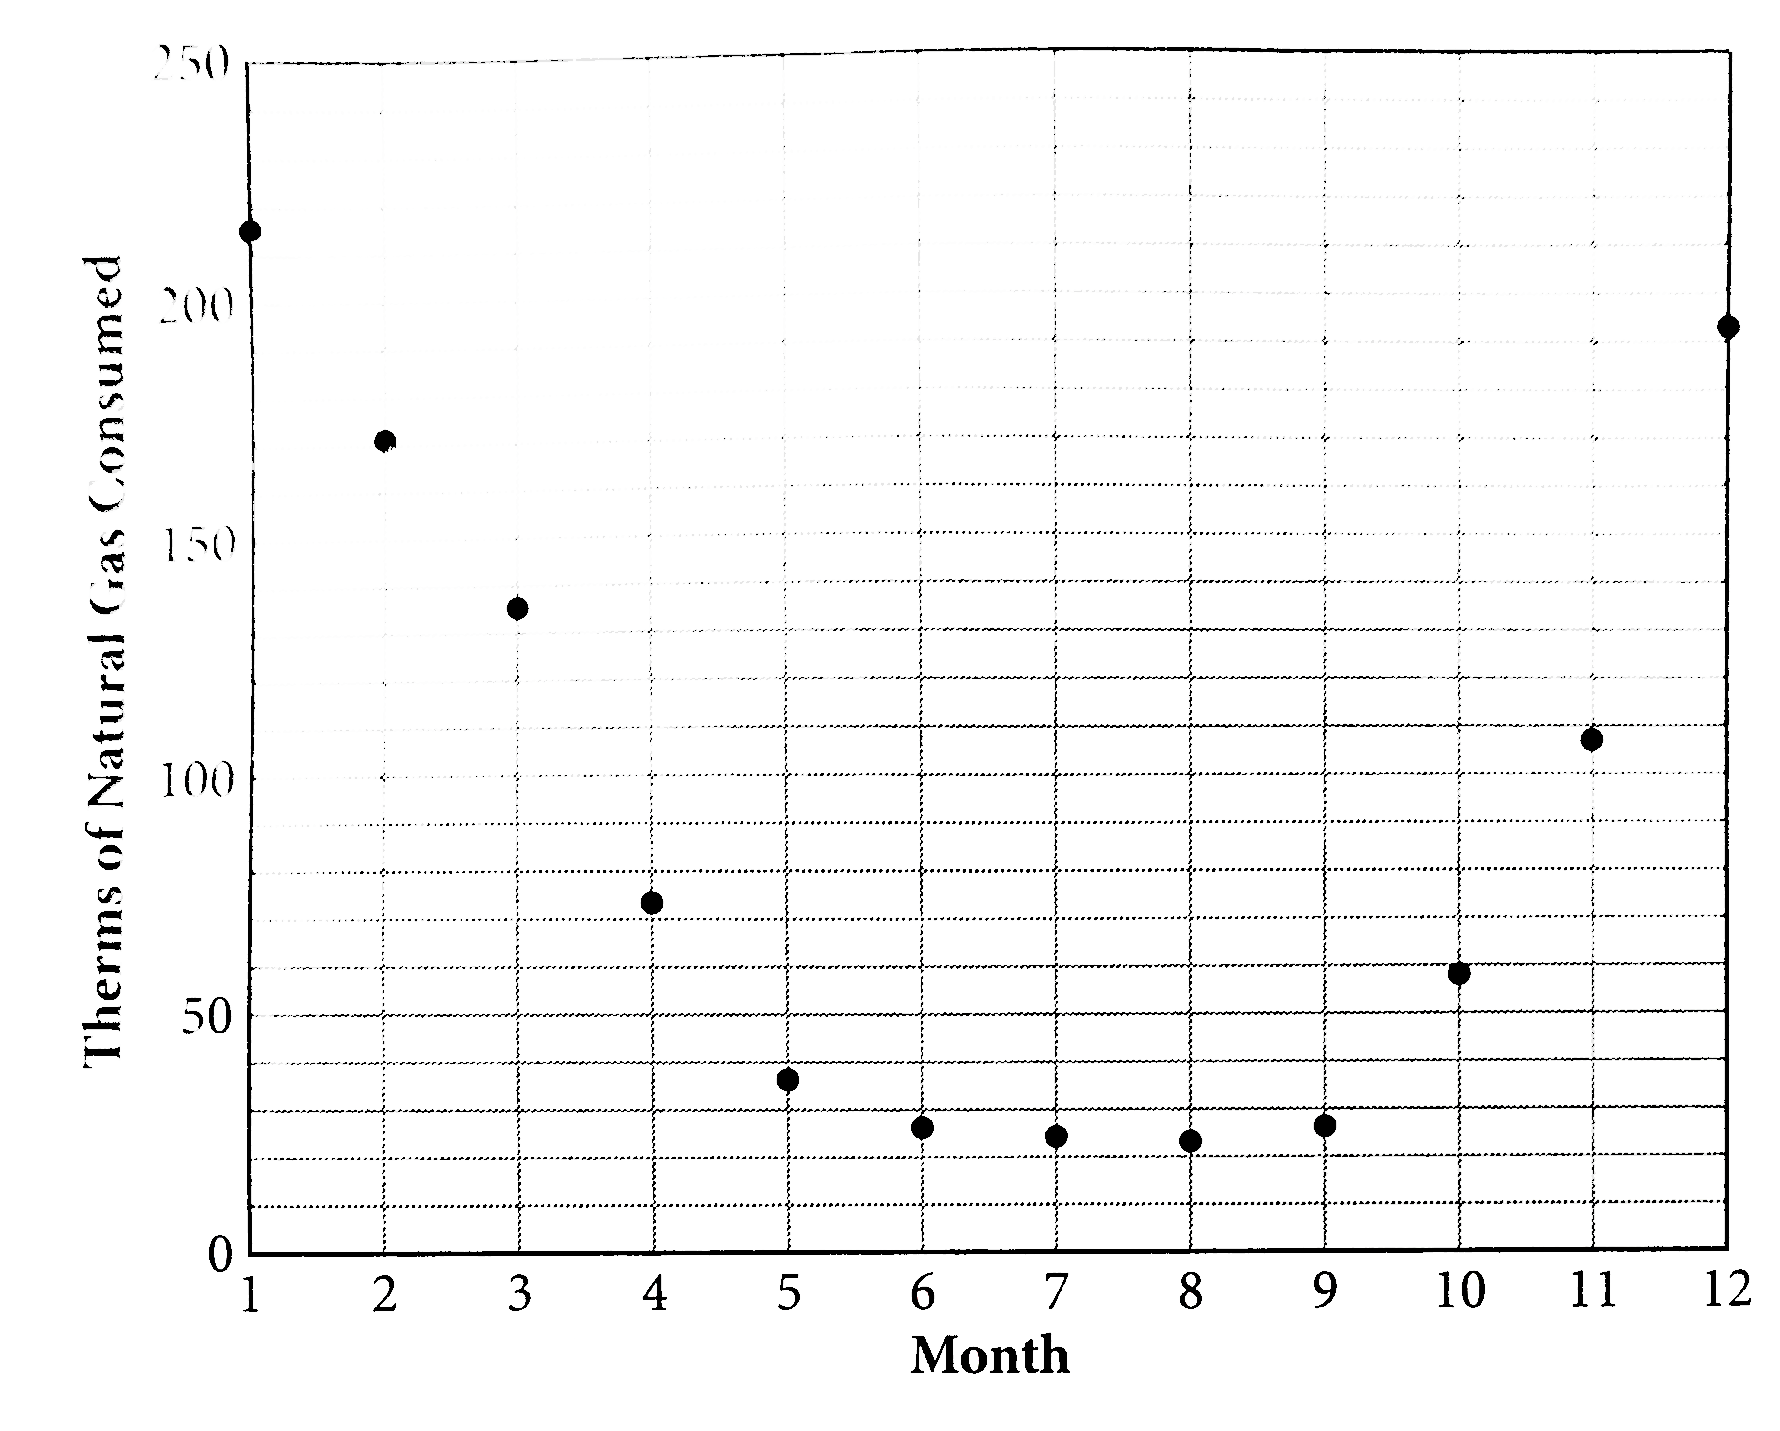
The scatterplot above shows the avrage therms of naturela gas used by residential constomeers over a 12-month period. Of the following equations, which best models the data in the scatterplot ?Ay=1.061x+312.9By=−1.061x−312.9Cy=6.1x2−85.1x+312.9Dy=−6.1x21+85.1x−312.9The scatterplot below shows the amount of electric energy generated, in millions of megawatt-hours, by nuclear sources over a 10‑year period.
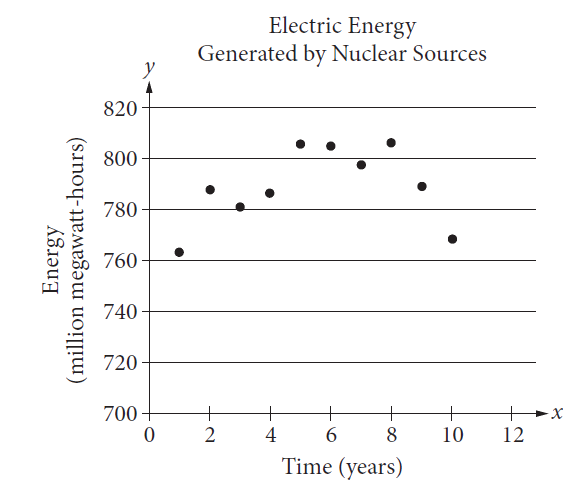
Of the following equations, which best models the data in the scatterplot?Ay=1.674x2+19.76x−745.73By=−1.674x2−19.76x−745.73Cy=1.674x2+19.76x+745.73Dy=−1.674x2+19.76x+745.73The scatterplot below compares the average gasoline prices I Boston, per gallon, to the average gasoline prices across the United States, per gallon, during a one-year period from 2017 to 2018.
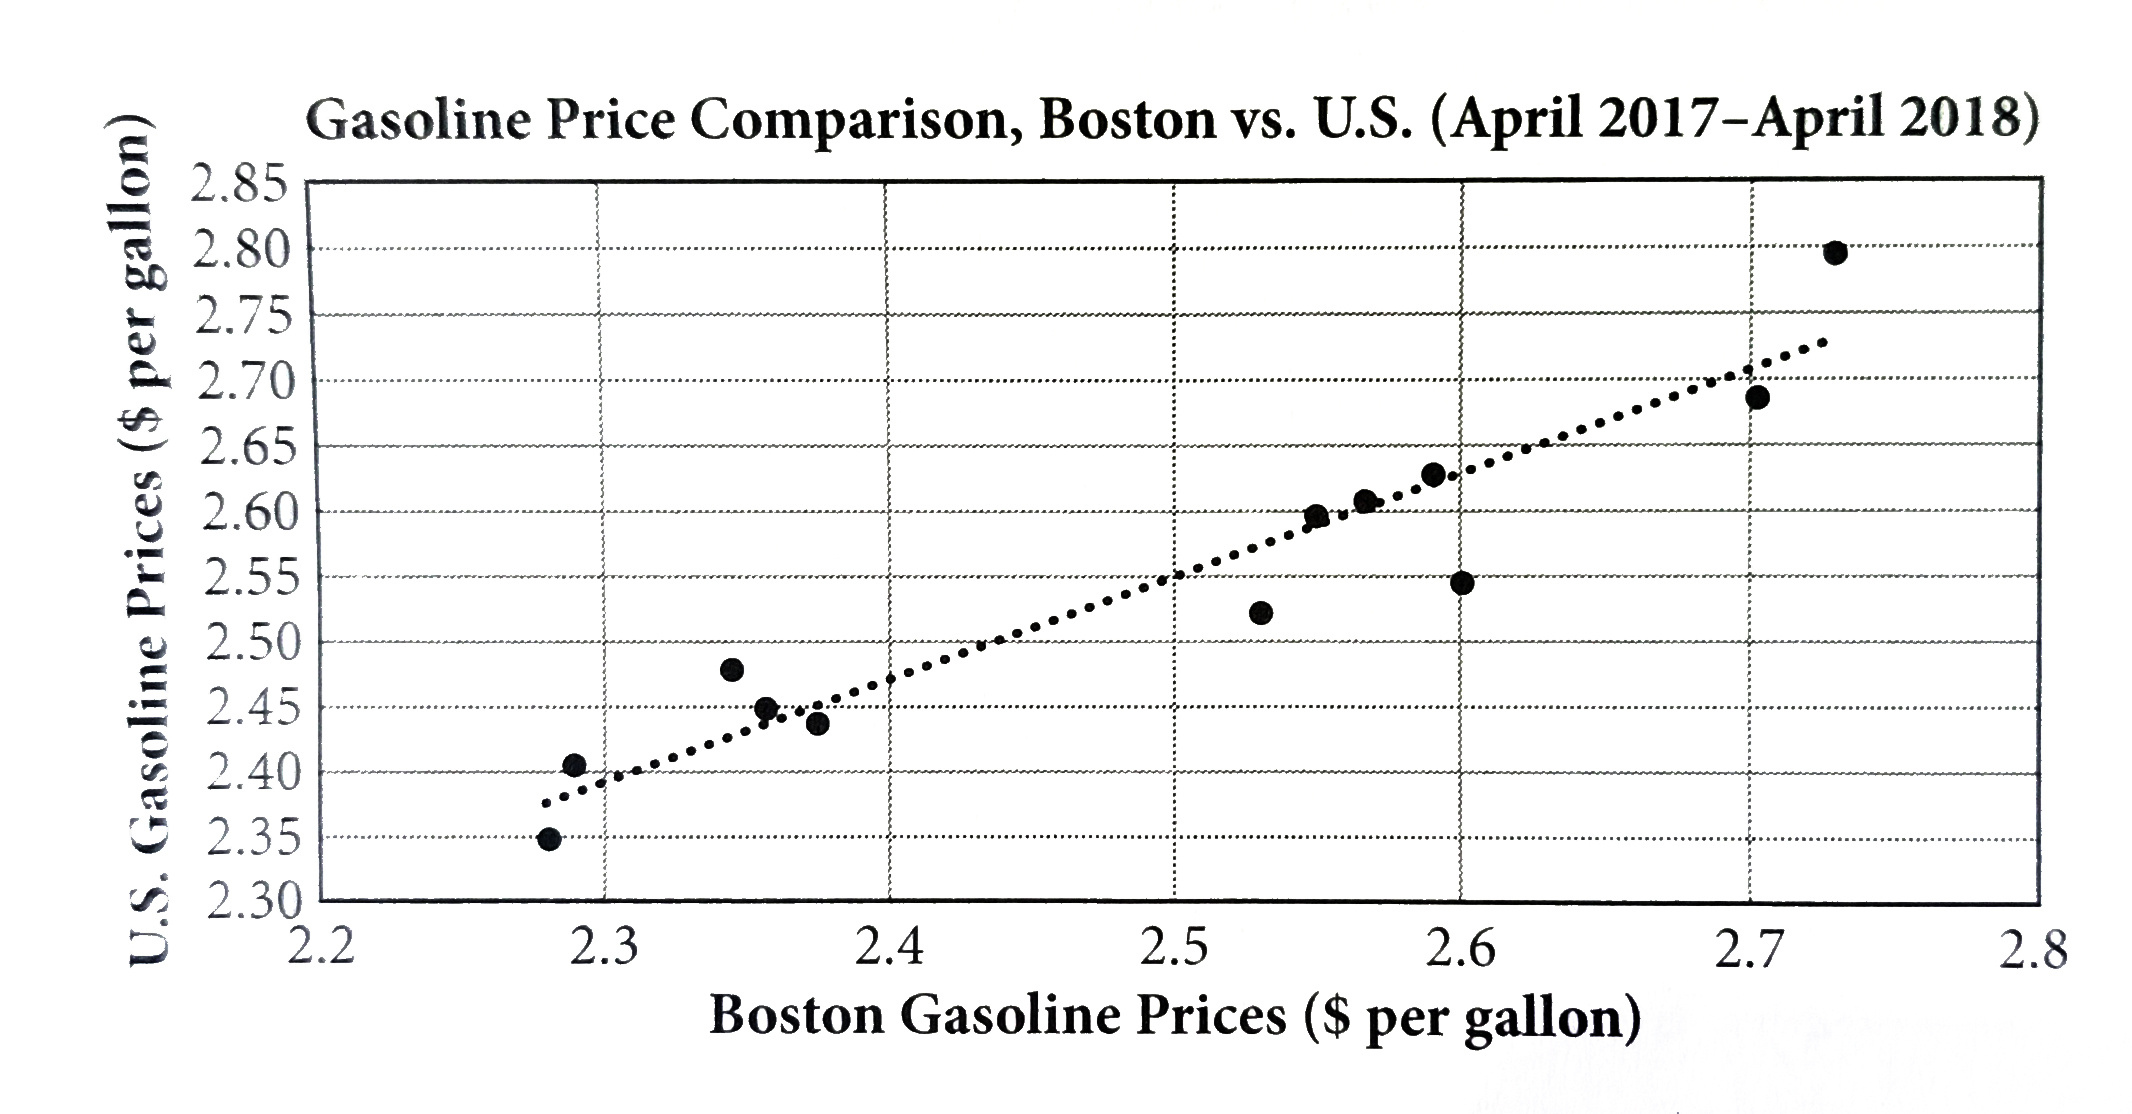
Of the following equations, whihc best modeles the data in the scatterplot ?Ay=−1.7848x+0.5842By=1.7848x+1.5842Cy=0.7848x+0.5842Dy=−0.7848x+0.5842
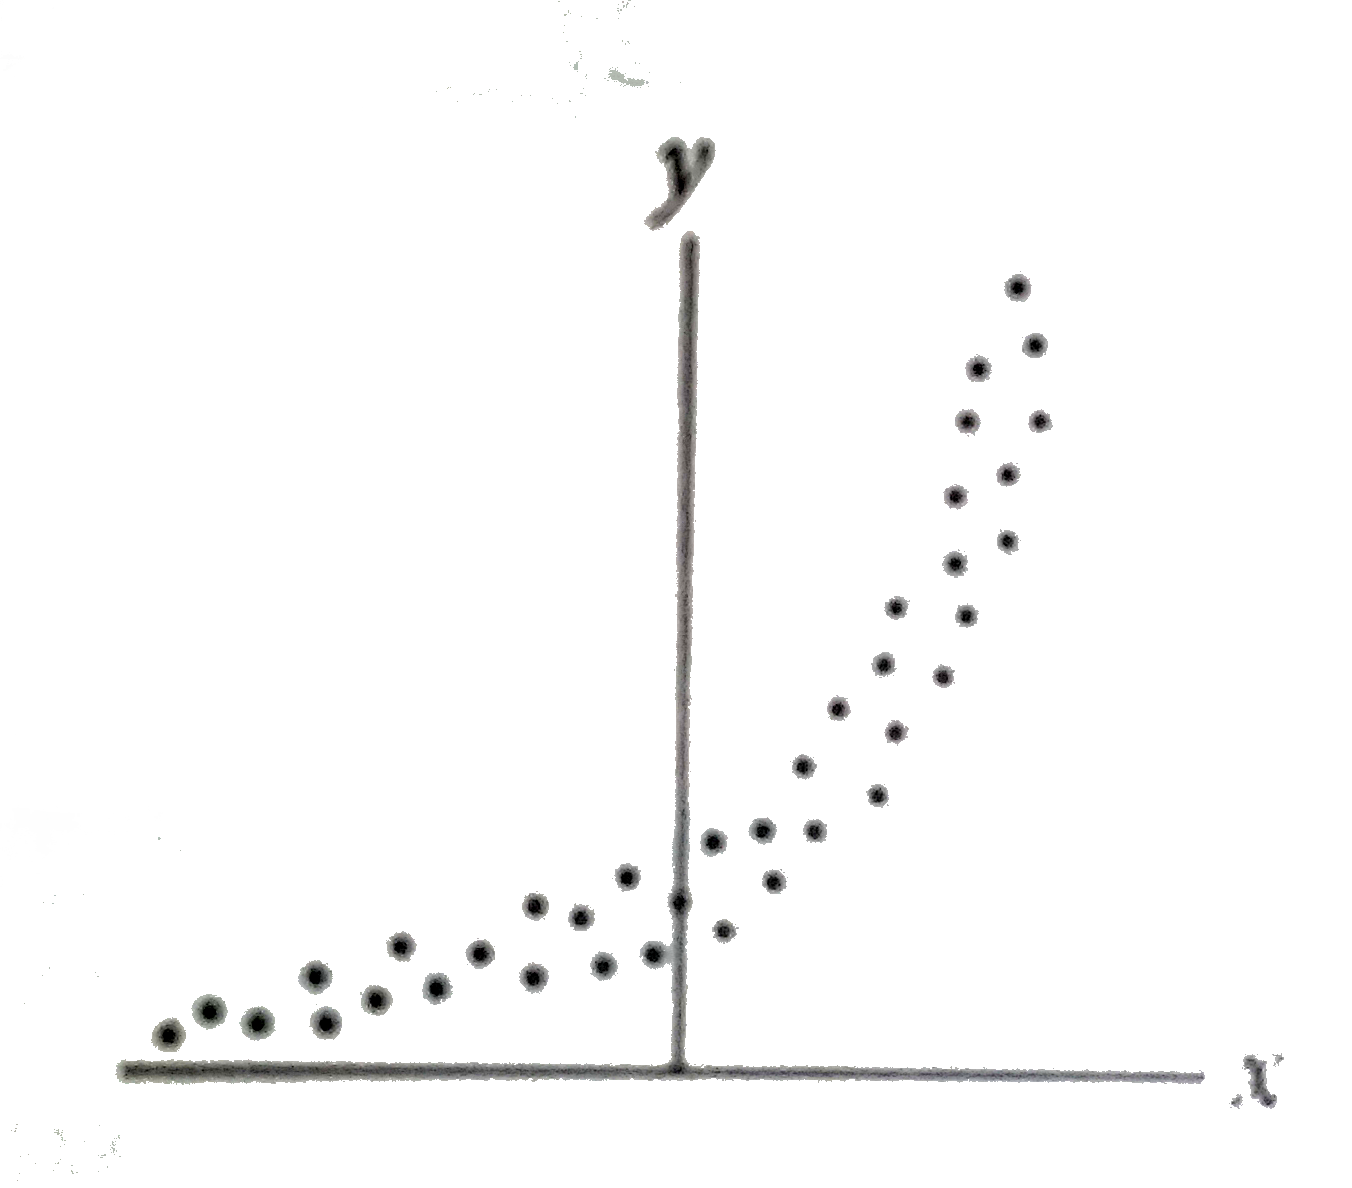
Which of the following best describes the type of association shown in the scatterplot above?
View SolutionWhich of the following equation is best representation of given graph's?
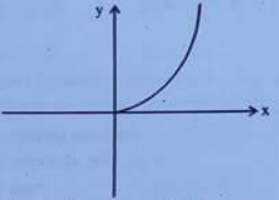
View SolutionWhich of the following equation is best representation of given graph's?
View Solution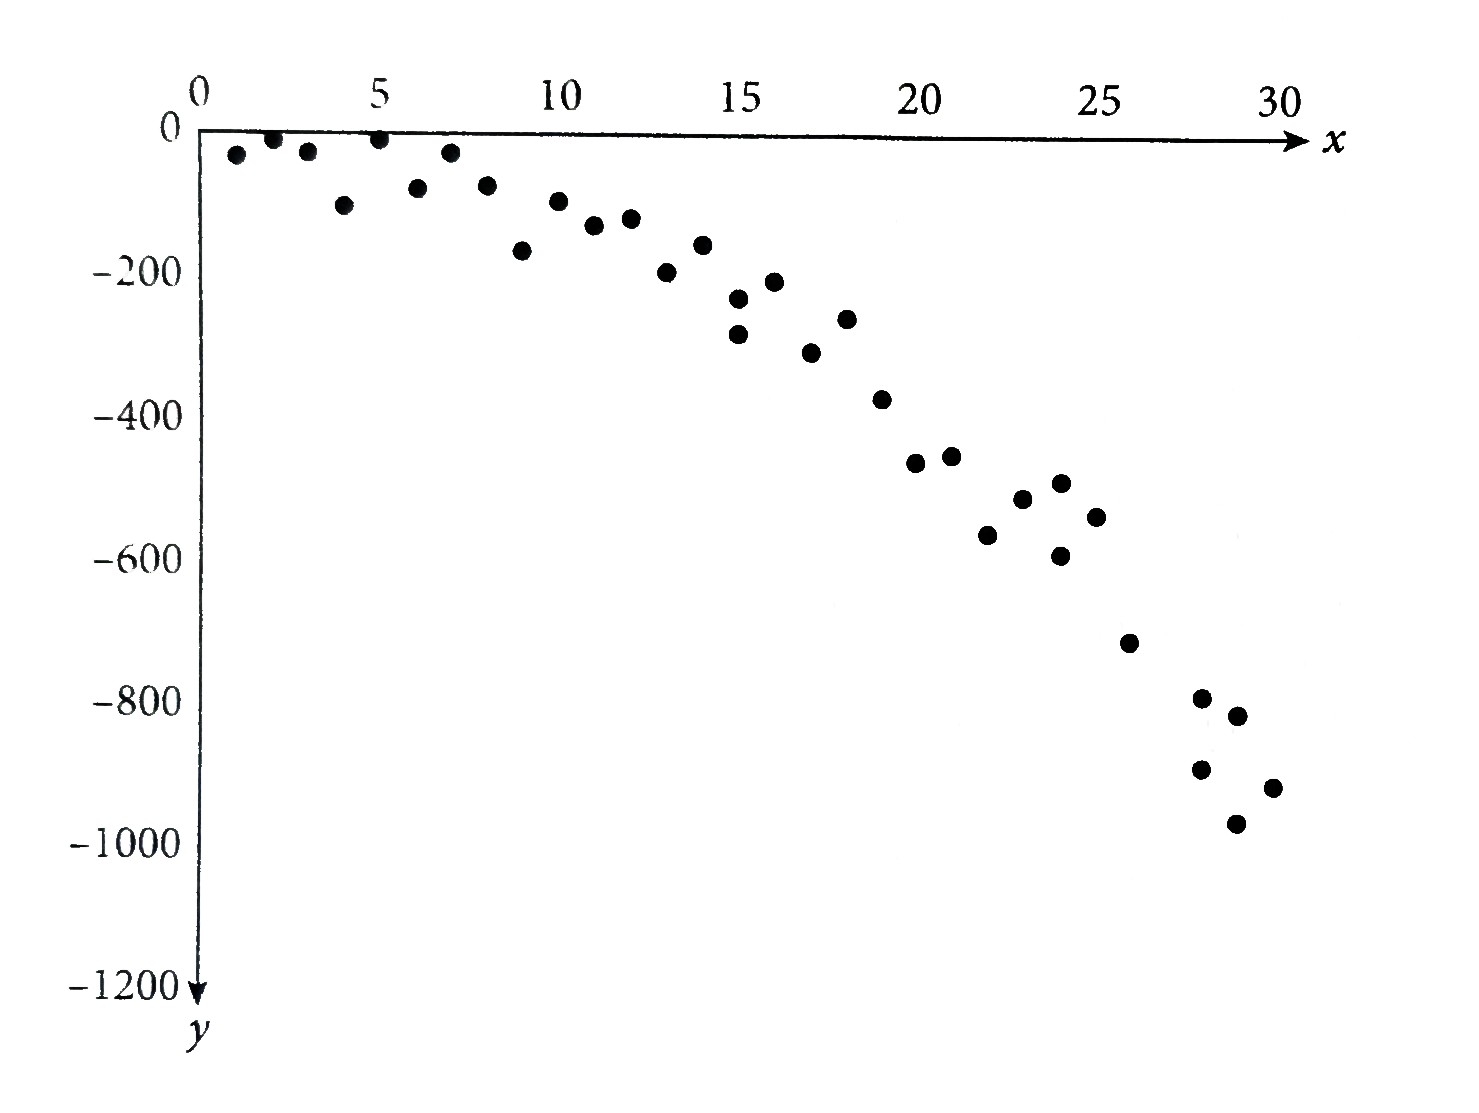
For which of the following values of a and b does the equation y=axb model the data in the scatterplot above ?
View Solution
Which of the following is the most accurate statement about the scatterplot above ?
View Solution

