For an experiment in botany, two different plants, plant A and B, were grown under similar laboratory conditions. Their heights were measured at the end of each week for three weeks. The results are shown by the line graph given below :
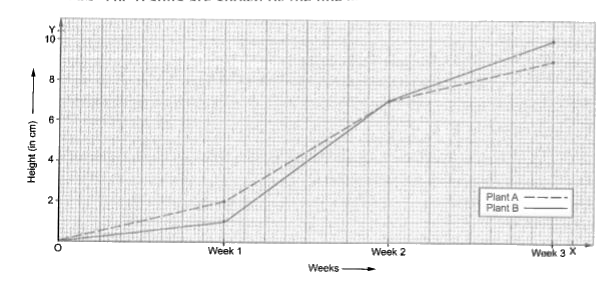
Study the above line graph carefully and answer the questions given below:
(i) How high was plant A after (a)2 weeks (b)3 weeks ?
(ii) How high was plant B after (a)2 weeks (b)3 weeks?
(iii) How much did plant A grow during the 3rd week?
(iv) How much did plant B grow from the end of the 2nd week to the end of the 3rd week ?
(v) During which week did plant A grow most ?
(vi) During which week did plant B grow least ?
(vii) Were the two plants of the same height during any week shown here ? Specify.
The correct Answer is:(i)(a)7cm (b)9cm (ii)(a)7cm (b)10cm (iii)2cm (iv)3cm (v)2nd week (vi)1st week (vii) At the end of 2nd week
Step by step video, text & image solution for For an experiment in botany, two different plants, plant A and B, were grown under similar laboratory conditions. Their heights were measured at the end of each week for three weeks. The results are shown by the line graph given below : Study the above line graph carefully and answer the questions given below: (i) How high was plant A after (a) 2 weeks (b) 3 weeks ? (ii) How high was plant B after (a) 2 weeks (b) 3 weeks? (iii) How much did plant A grow during the 3rd week? (iv) How much did plant B grow from the end of the 2nd week to the end of the 3rd week ? (v) During which week did plant A grow most ? (vi) During which week did plant B grow least ? (vii) Were the two plants of the same height during any week shown here ? Specify. by Maths experts to help you in doubts & scoring excellent marks in Class 8 exams.
Updated on:21/07/2023Topper's Solved these Questions
- LINE GRAPHS AND LINEAR GRAPHSBOOK - RS AGGARWALCHAPTER - LINE GRAPHS AND LINEAR GRAPHSEXERCISE - Exercise 23
25 Videos
- INTRODUCTION TO COORDINATE GEOMETRYBOOK - RS AGGARWALCHAPTER - INTRODUCTION TO COORDINATE GEOMETRYEXERCISE - EXERCISE B (OBJECTIVE QUESTIONS)
7 Videos
- LINEAR EQUATIONSBOOK - RS AGGARWALCHAPTER - LINEAR EQUATIONSEXERCISE - TEST PAPER-8 (D) (Write .T. for true and .F. for false for each of the following:)
1 Videos
Similar Questions
For an experiment in Botany, two different plants, plant A and plant B were grown under similar laboratory conditions. Their heights were measured at the end of each week for 3 weeks. The results are shown by the following graph.(a) How high was Plant A after (i) 2 weeks (ii) 3 weeks?(b) How high was Plant B after (i) 2 weeks (ii) 3 weeks?(c) How much did Plant A grow during the 3rd week?(d) How much did Plant B grow from the end of the 2nd week to the end of the 3rd week?(e) During which week did Plant A grow most?(f) During which week did Plant B grow least?(g) Were the two plants of the same height during any week shown here? Specify.
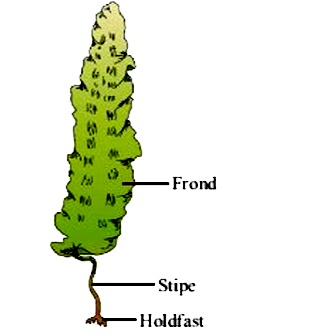
View SolutionStudy the following diagram carefully and select the correct statement given below for this plant :-
View Solution
Knowledge Check
Study the following graph carefully and answer the question given below-----
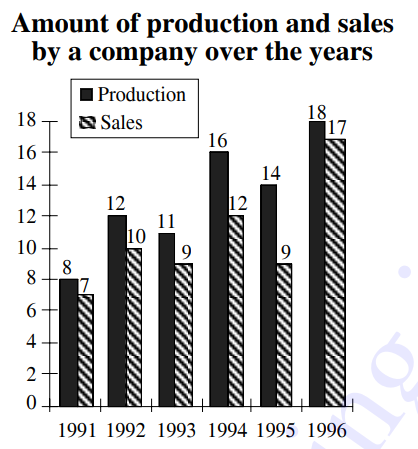
What was the difference between the sales of 1992 and 1995 ?A10 lakh tonnesB50 thousand tonnesC1 lakh tonnesD75 thousand tonnesStudy the following graph carefully and answer the question given below-----
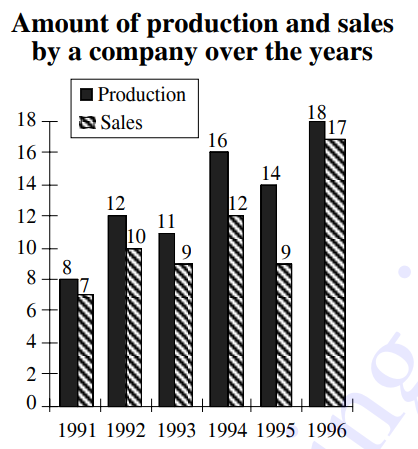
What was the percentage drop in sales from 1992 to 1993 ?A1B10C20D15Study the following graph carefully and answer the questions given below it -----
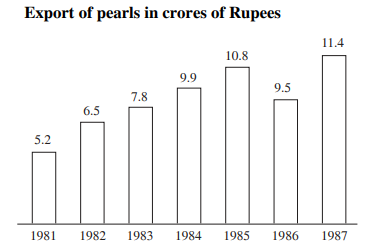
What was the percentage increase in export from 1986 to 1987 ?A1623%B20%C19%D3313%
Look at the bar graph given below:
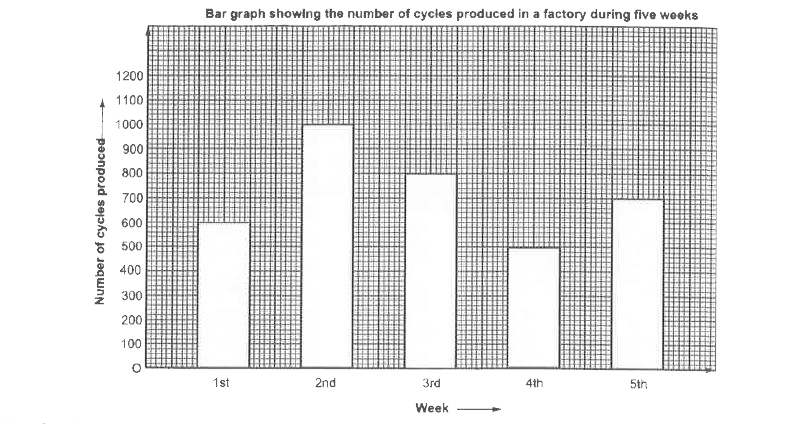
Study the bar graph carefully and answer the question given below:
In which week was the production maximum ?
What is the average production during these five weeks ?
How many cycles were produced in the first 3 weeks ?
View SolutionStudy the following graph carefully and answer the questions given below it -----
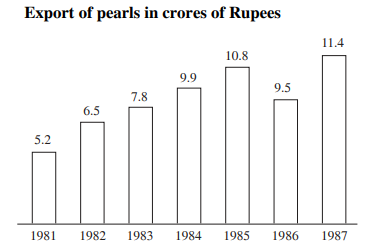
In how many years was the export above the average for the given period ?
View SolutionThe following bar graph shows the games played by the students. Study the graph carefully and answer the question given below:
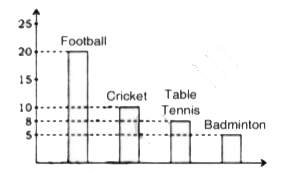
How many students play table tennis?
View SolutionStudy the graph carefully and answer the following questions.
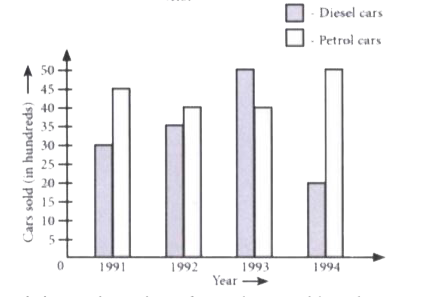
How many cars were sold during the year 1991?
View SolutionStudy the following graph carefully and answer the questions given below –
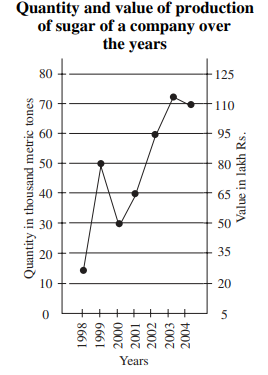
In which of the following years was the value of sugar per metric ton the lowest among the given years?
View Solution
