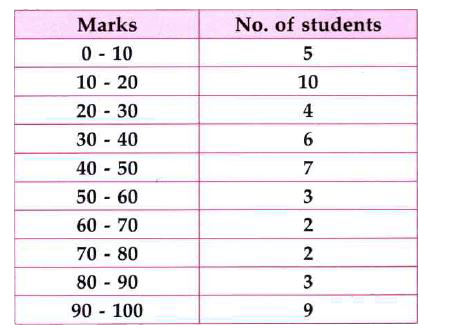
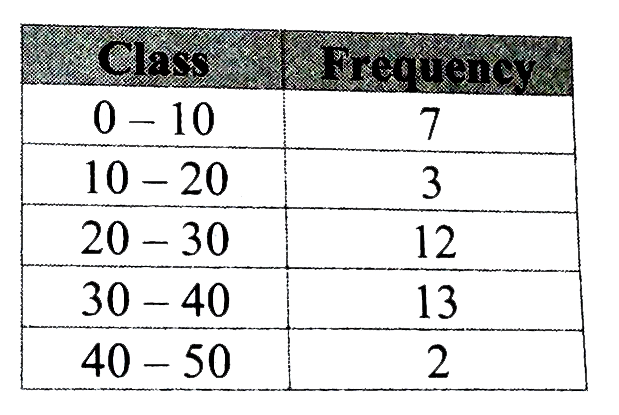
From the following data , draw the two types of cumulative frequency curves and determine the median
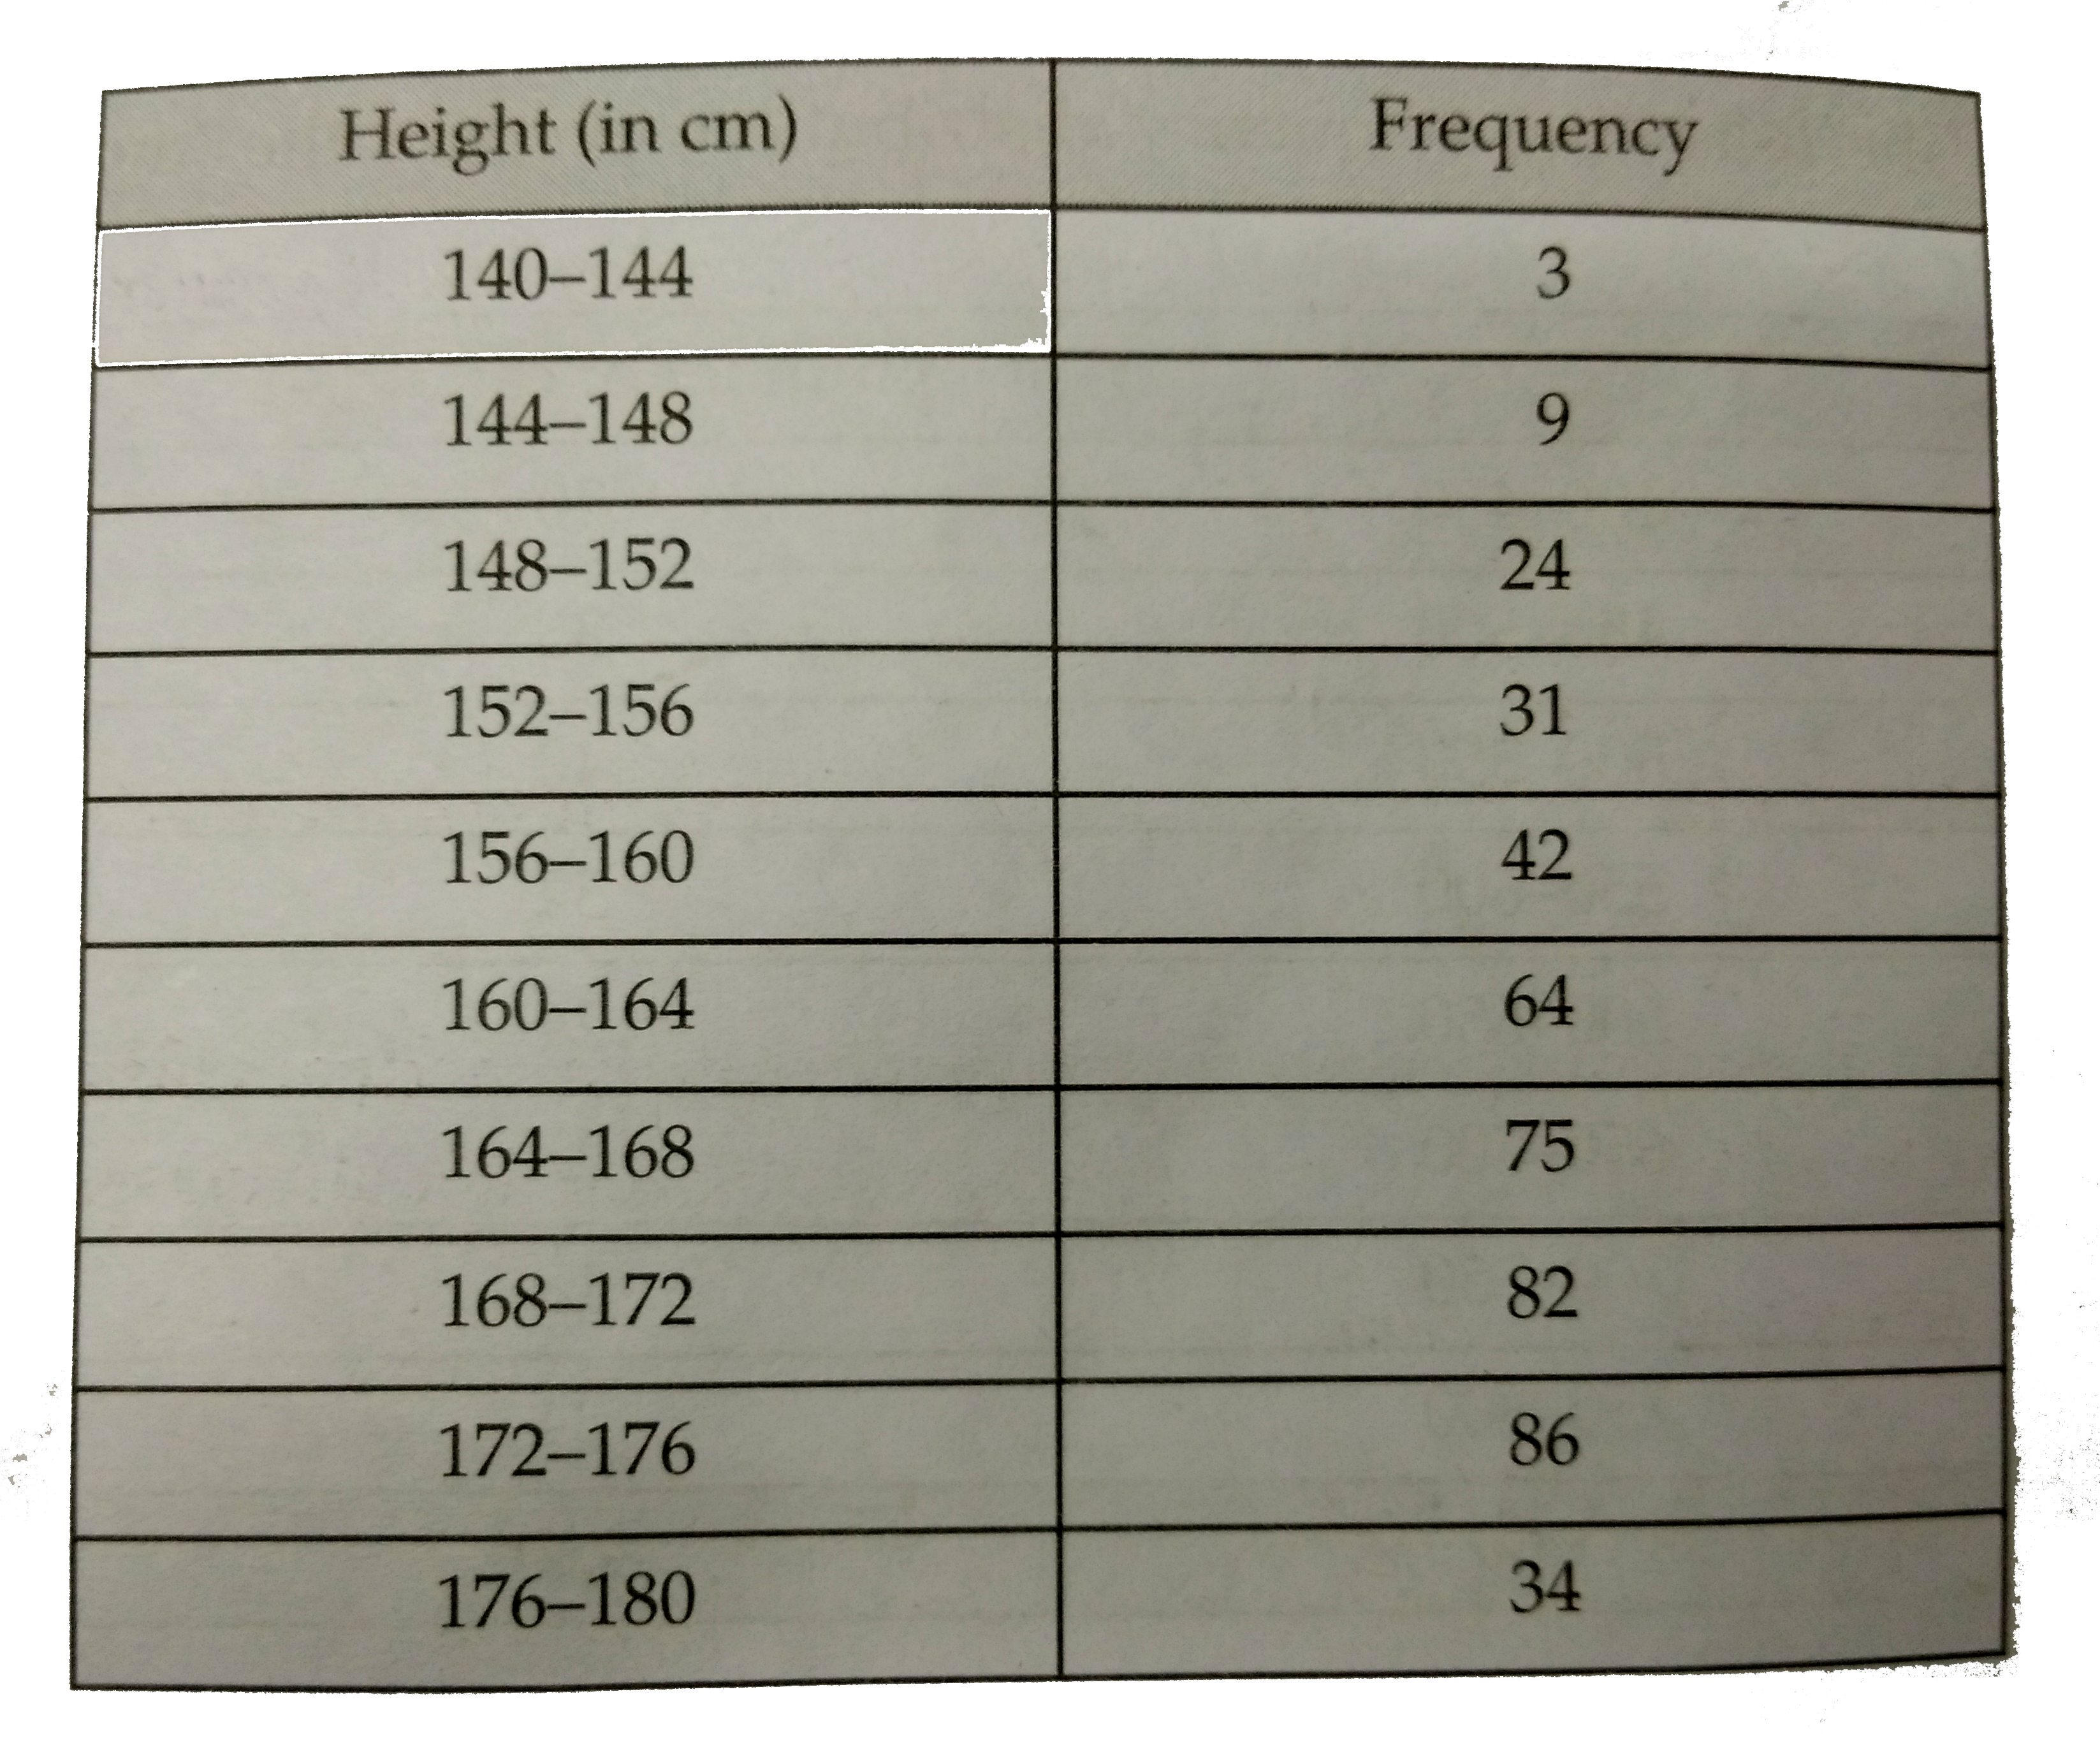
The correct Answer is:NA
Step by step video & image solution for From the following data , draw the two types of cumulative frequency curves and determine the median by Maths experts to help you in doubts & scoring excellent marks in Class 10 exams.
Updated on:21/07/2023Topper's Solved these Questions
- MEAN,MEDAN,MODE OF GROUPED,DATA CUMULATIVE FREQUENCY GRAPH AND OGIVE BOOK - RS AGGARWALCHAPTER - MEAN,MEDAN,MODE OF GROUPED,DATA CUMULATIVE FREQUENCY GRAPH AND OGIVE EXERCISE - EXERCISE 18 F
13 Videos
- MEAN,MEDAN,MODE OF GROUPED,DATA CUMULATIVE FREQUENCY GRAPH AND OGIVE BOOK - RS AGGARWALCHAPTER - MEAN,MEDAN,MODE OF GROUPED,DATA CUMULATIVE FREQUENCY GRAPH AND OGIVE EXERCISE - Exercise 18F
9 Videos
- MEAN,MEDAN,MODE OF GROUPED,DATA CUMULATIVE FREQUENCY GRAPH AND OGIVE BOOK - RS AGGARWALCHAPTER - MEAN,MEDAN,MODE OF GROUPED,DATA CUMULATIVE FREQUENCY GRAPH AND OGIVE EXERCISE - EXERCISE 18 D
3 Videos
- LINEAR EQUATIONS IN TWO VARIABLES BOOK - RS AGGARWALCHAPTER - LINEAR EQUATIONS IN TWO VARIABLES EXERCISE - QUESTION
2 Videos
- PERIMETER AND AREA OF PLANE FIGURES BOOK - RS AGGARWALCHAPTER - PERIMETER AND AREA OF PLANE FIGURES EXERCISE - TEST YOURSELF (SHORT -ANSWER QUESTIONS)
1 Videos
Similar Questions
Knowledge Check
The cumulative frequency table is useful in determining the
AmeanBmedianCmodeDall of these
For the following frequency distribution, draw a cumulative frequency curve of more than type and hence obtain the median value:

View SolutionCalculation of Median by drawing two types of cumulative frequency polygon.
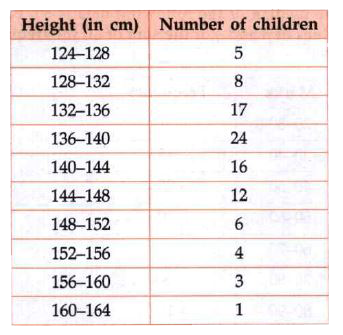
View SolutionThe distribution of heights (in cm) of 96 children is given below:
Draw a less than type cumulative frequency curve for this data and use it to compute median height of the children.
View SolutionRecast the following cumulative table in the from of an ordinary frequency distribution and determine the value of the mode by using the formula : mode = 3 median -2 mean
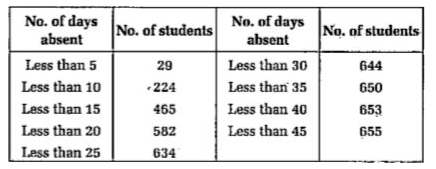
View SolutionFor the following frequency distribution draw a cumulative frequency curve of 'more than type' and hence obtain the median value [Class0−1010−2020−3030−4040−5050−6060−70Frequency515202317119]
View SolutionThe weight of tea in 70 packets are shown in the following table
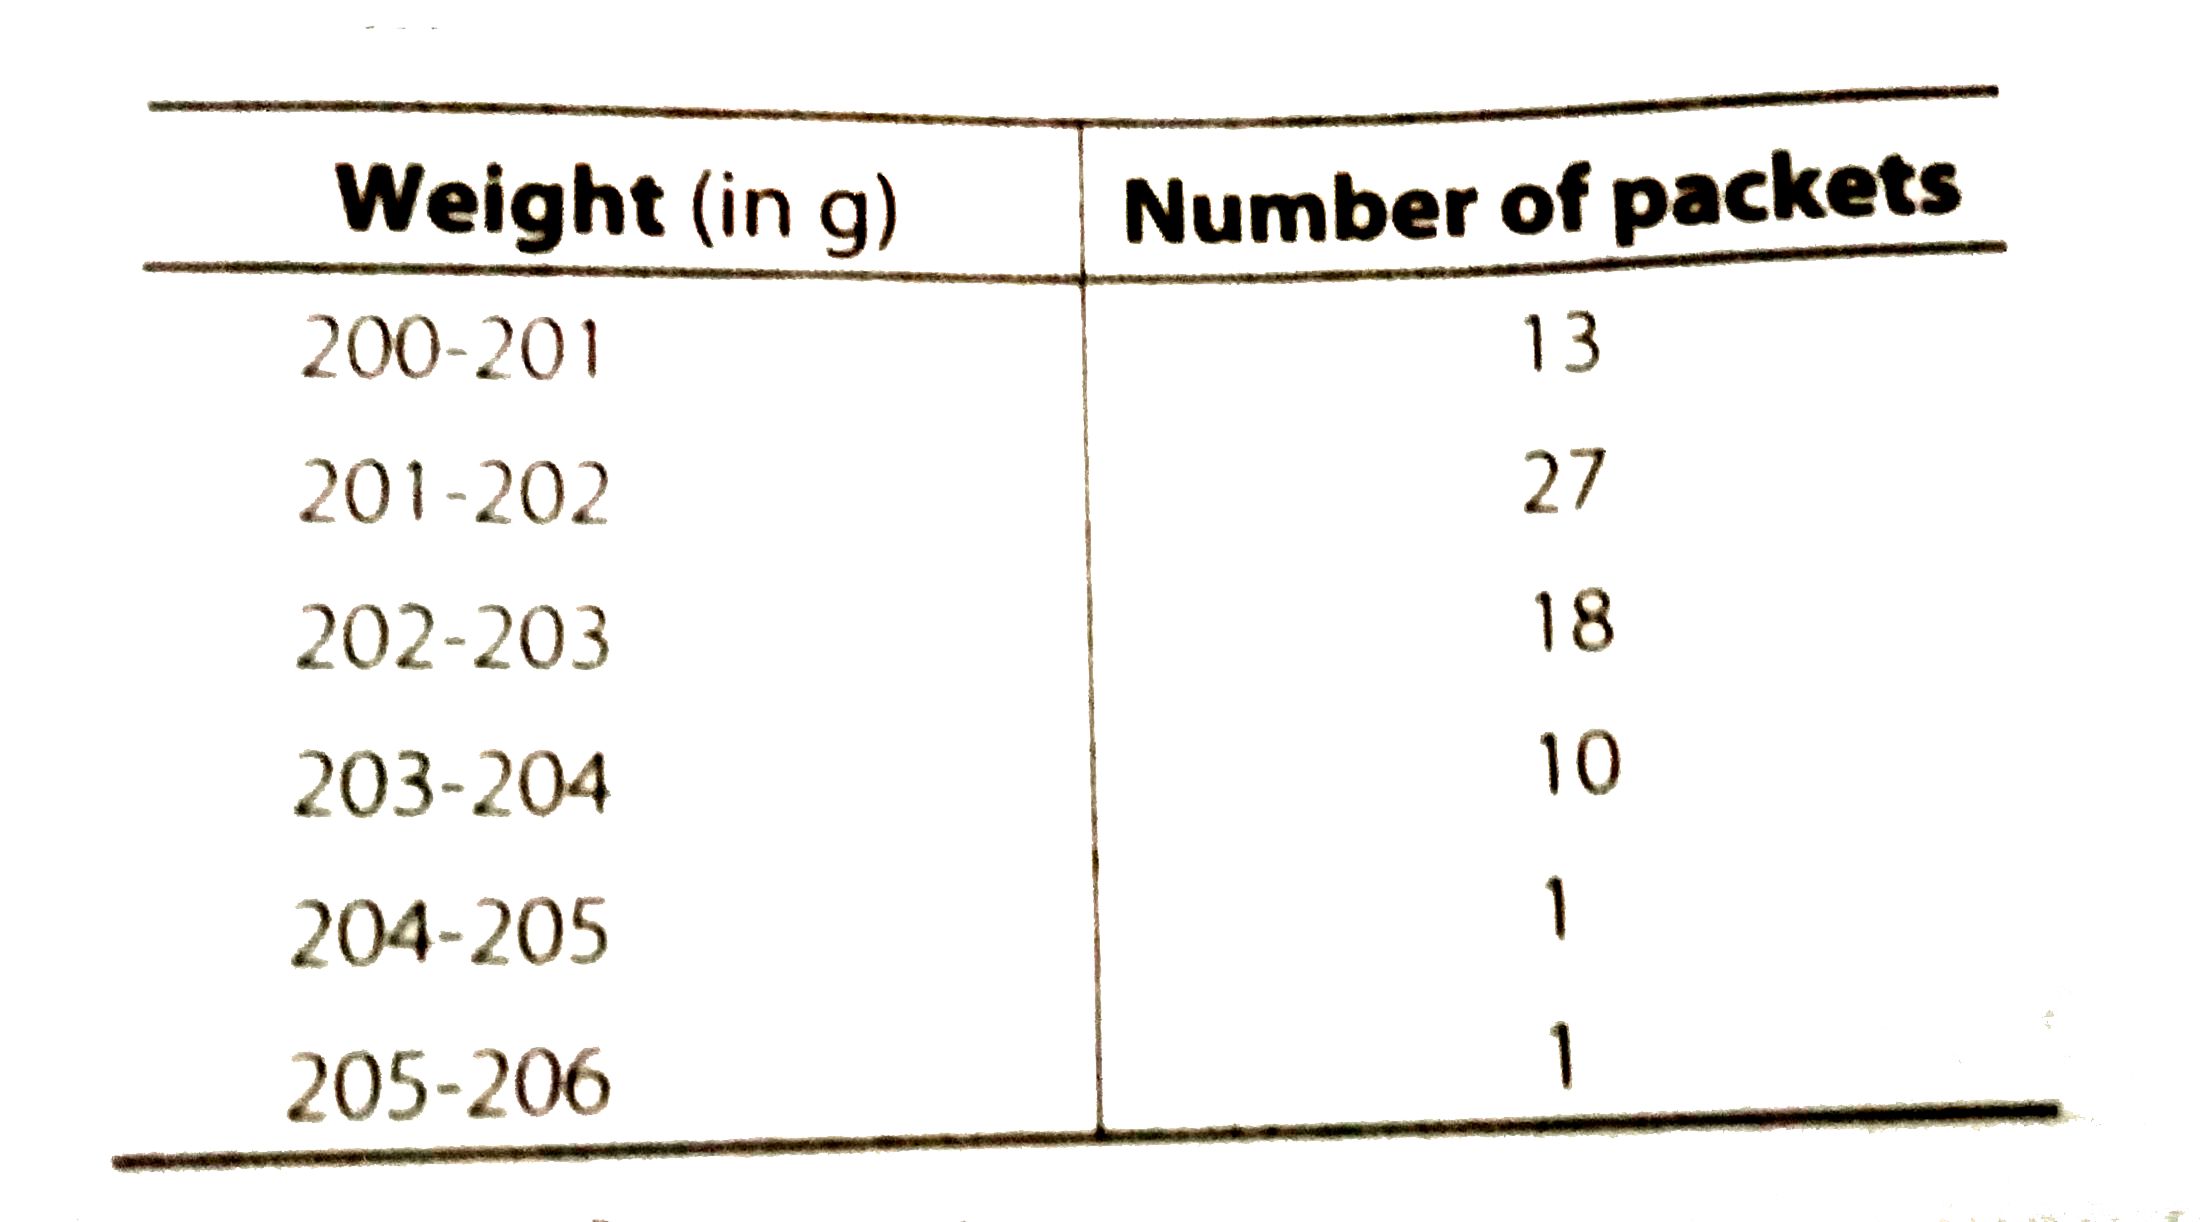
Find the mean weight of packets.
View SolutionMake the frequency table and the cumulative frequency curve for following data
View Solution

