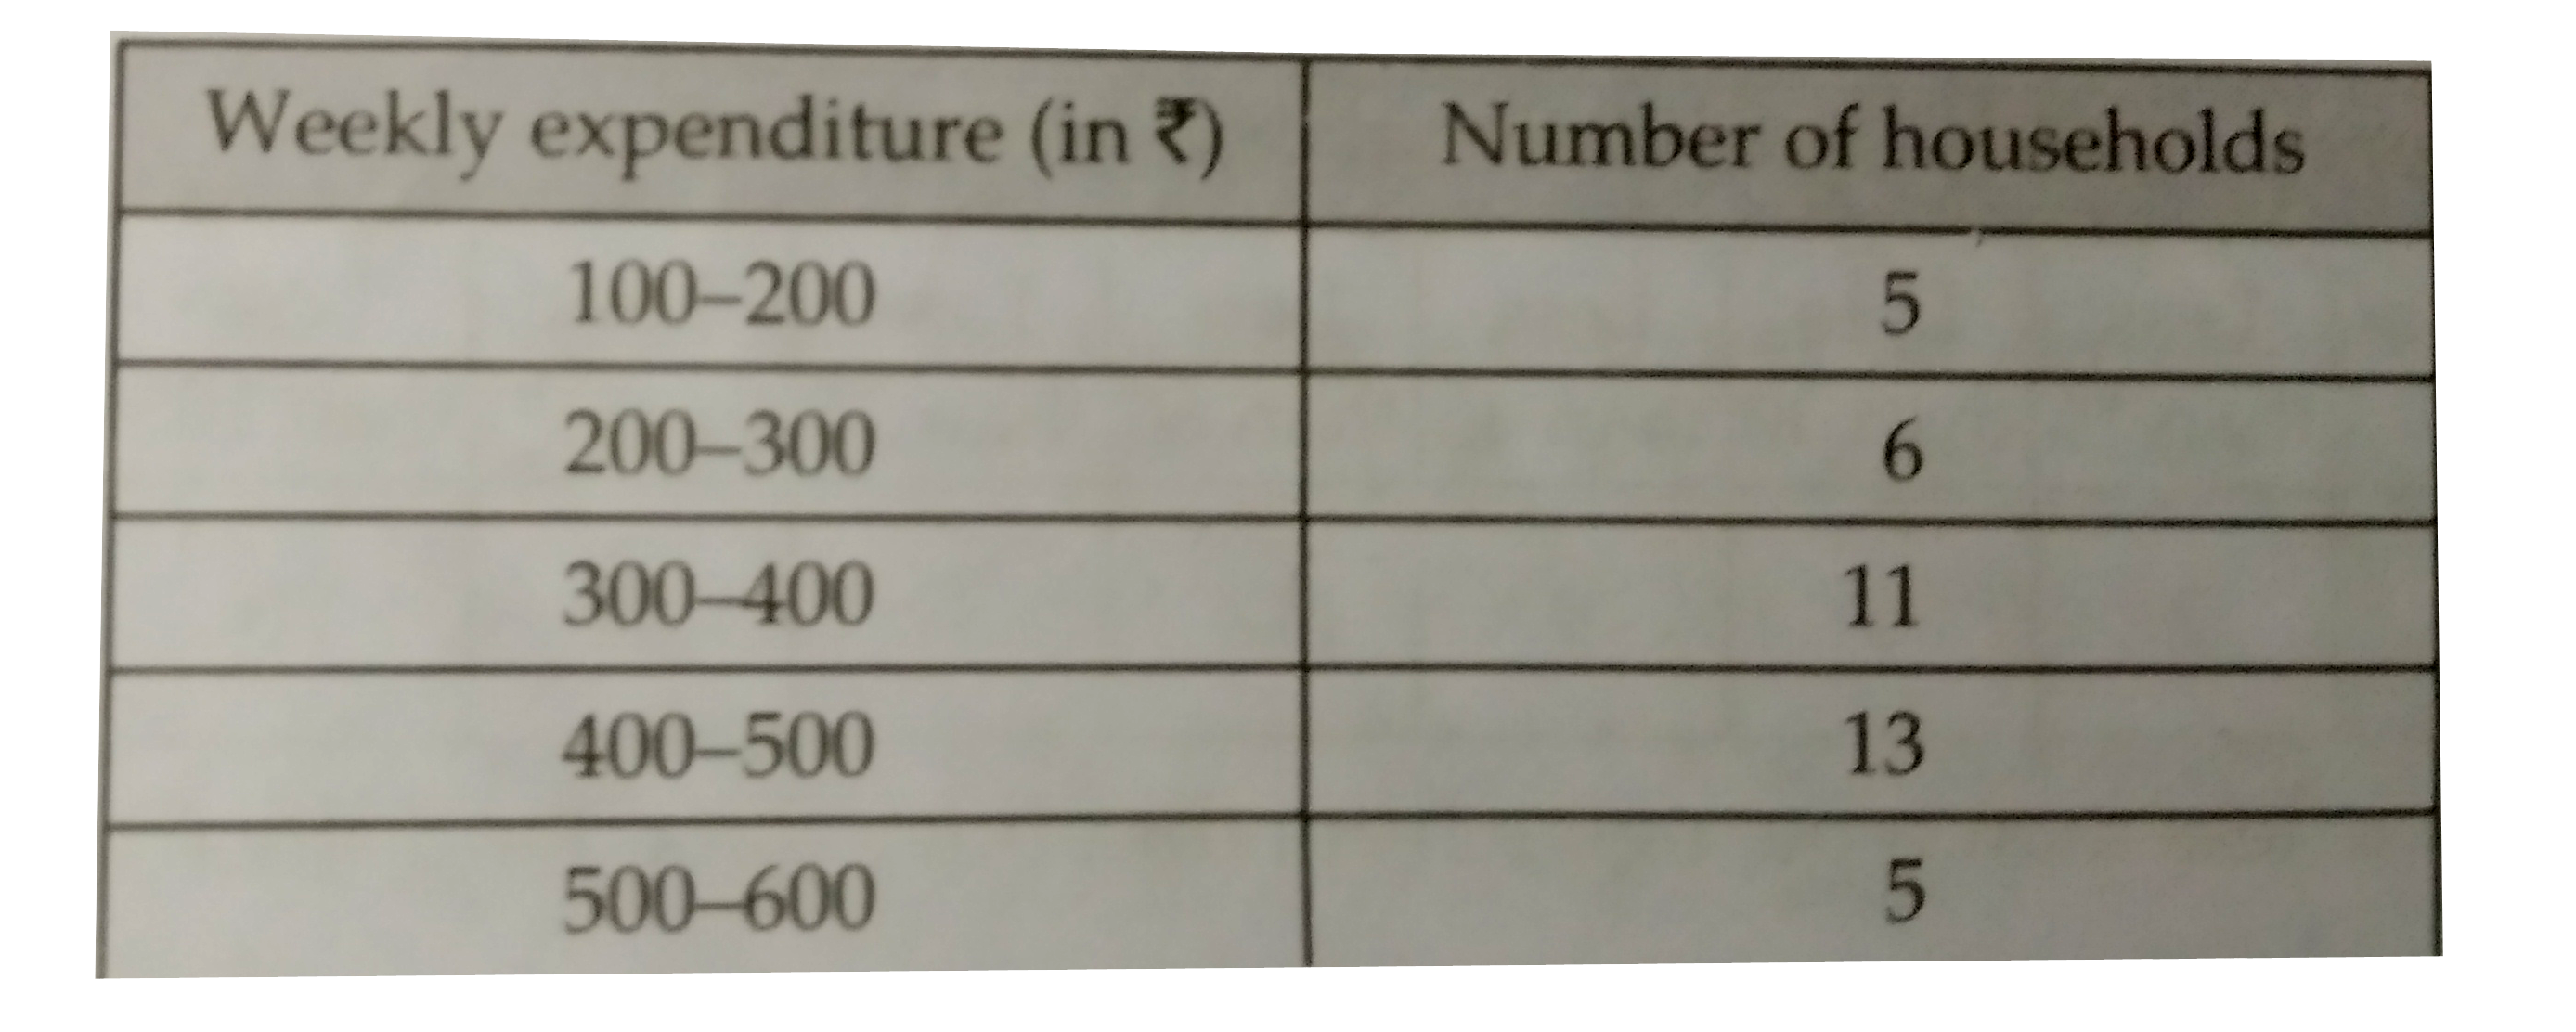
The table given below shows the weekly expenditures on food of some household in a locality


Draw a "less than type ogive" and a "more than type ogive" for this distribution.
The correct Answer is:NA
Step by step video & image solution for The table given below shows the weekly expenditures on food of some household in a locality Draw a "less than type ogive" and a "more than type ogive" for this distribution. by Maths experts to help you in doubts & scoring excellent marks in Class 10 exams.
Updated on:21/07/2023Topper's Solved these Questions
- MEAN,MEDAN,MODE OF GROUPED,DATA CUMULATIVE FREQUENCY GRAPH AND OGIVE BOOK - RS AGGARWALCHAPTER - MEAN,MEDAN,MODE OF GROUPED,DATA CUMULATIVE FREQUENCY GRAPH AND OGIVE EXERCISE - EXERCISE 18 F
13 Videos
- MEAN,MEDAN,MODE OF GROUPED,DATA CUMULATIVE FREQUENCY GRAPH AND OGIVE BOOK - RS AGGARWALCHAPTER - MEAN,MEDAN,MODE OF GROUPED,DATA CUMULATIVE FREQUENCY GRAPH AND OGIVE EXERCISE - Exercise 18F
9 Videos
- MEAN,MEDAN,MODE OF GROUPED,DATA CUMULATIVE FREQUENCY GRAPH AND OGIVE BOOK - RS AGGARWALCHAPTER - MEAN,MEDAN,MODE OF GROUPED,DATA CUMULATIVE FREQUENCY GRAPH AND OGIVE EXERCISE - EXERCISE 18 D
3 Videos
- LINEAR EQUATIONS IN TWO VARIABLES BOOK - RS AGGARWALCHAPTER - LINEAR EQUATIONS IN TWO VARIABLES EXERCISE - QUESTION
2 Videos
- PERIMETER AND AREA OF PLANE FIGURES BOOK - RS AGGARWALCHAPTER - PERIMETER AND AREA OF PLANE FIGURES EXERCISE - TEST YOURSELF (SHORT -ANSWER QUESTIONS)
1 Videos
Similar Questions
Knowledge Check
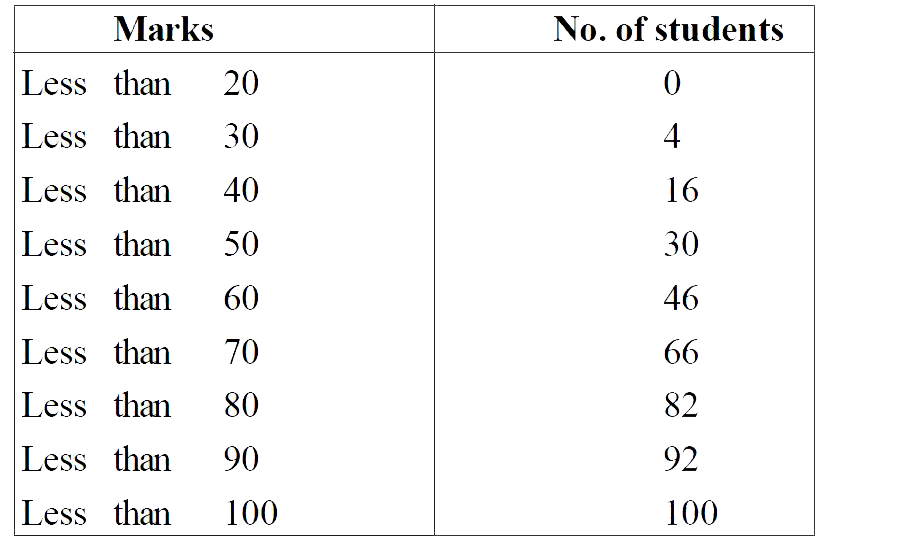
Draw 'less than' and 'more than' ogive curves from the following data :
 AMediumBModeCArithmetic meanDnone of these
The 'less than' ogive curve and the 'more than' ogive curve intersect at
AmedianBmodeCarithmetic meanDNone of the above
Construct a less than ogive and a more than ogive from the following data :

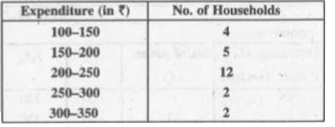
View SolutionThe table below shows the daily expenditure on food of 25 households in a locality.Find the mean daily expenditure on food by a suitable method.
View SolutionDraw a less than cumuative frequency curve (ogive) for the following distribution :

View SolutionDraw a 'less than' ogive of the following data

View SolutionDraw 'less than' as well as 'more than' ogives for the following data :

View Solutionfor the following data, draw a less than ogive and hence find the median of the distribution.
View Solution


