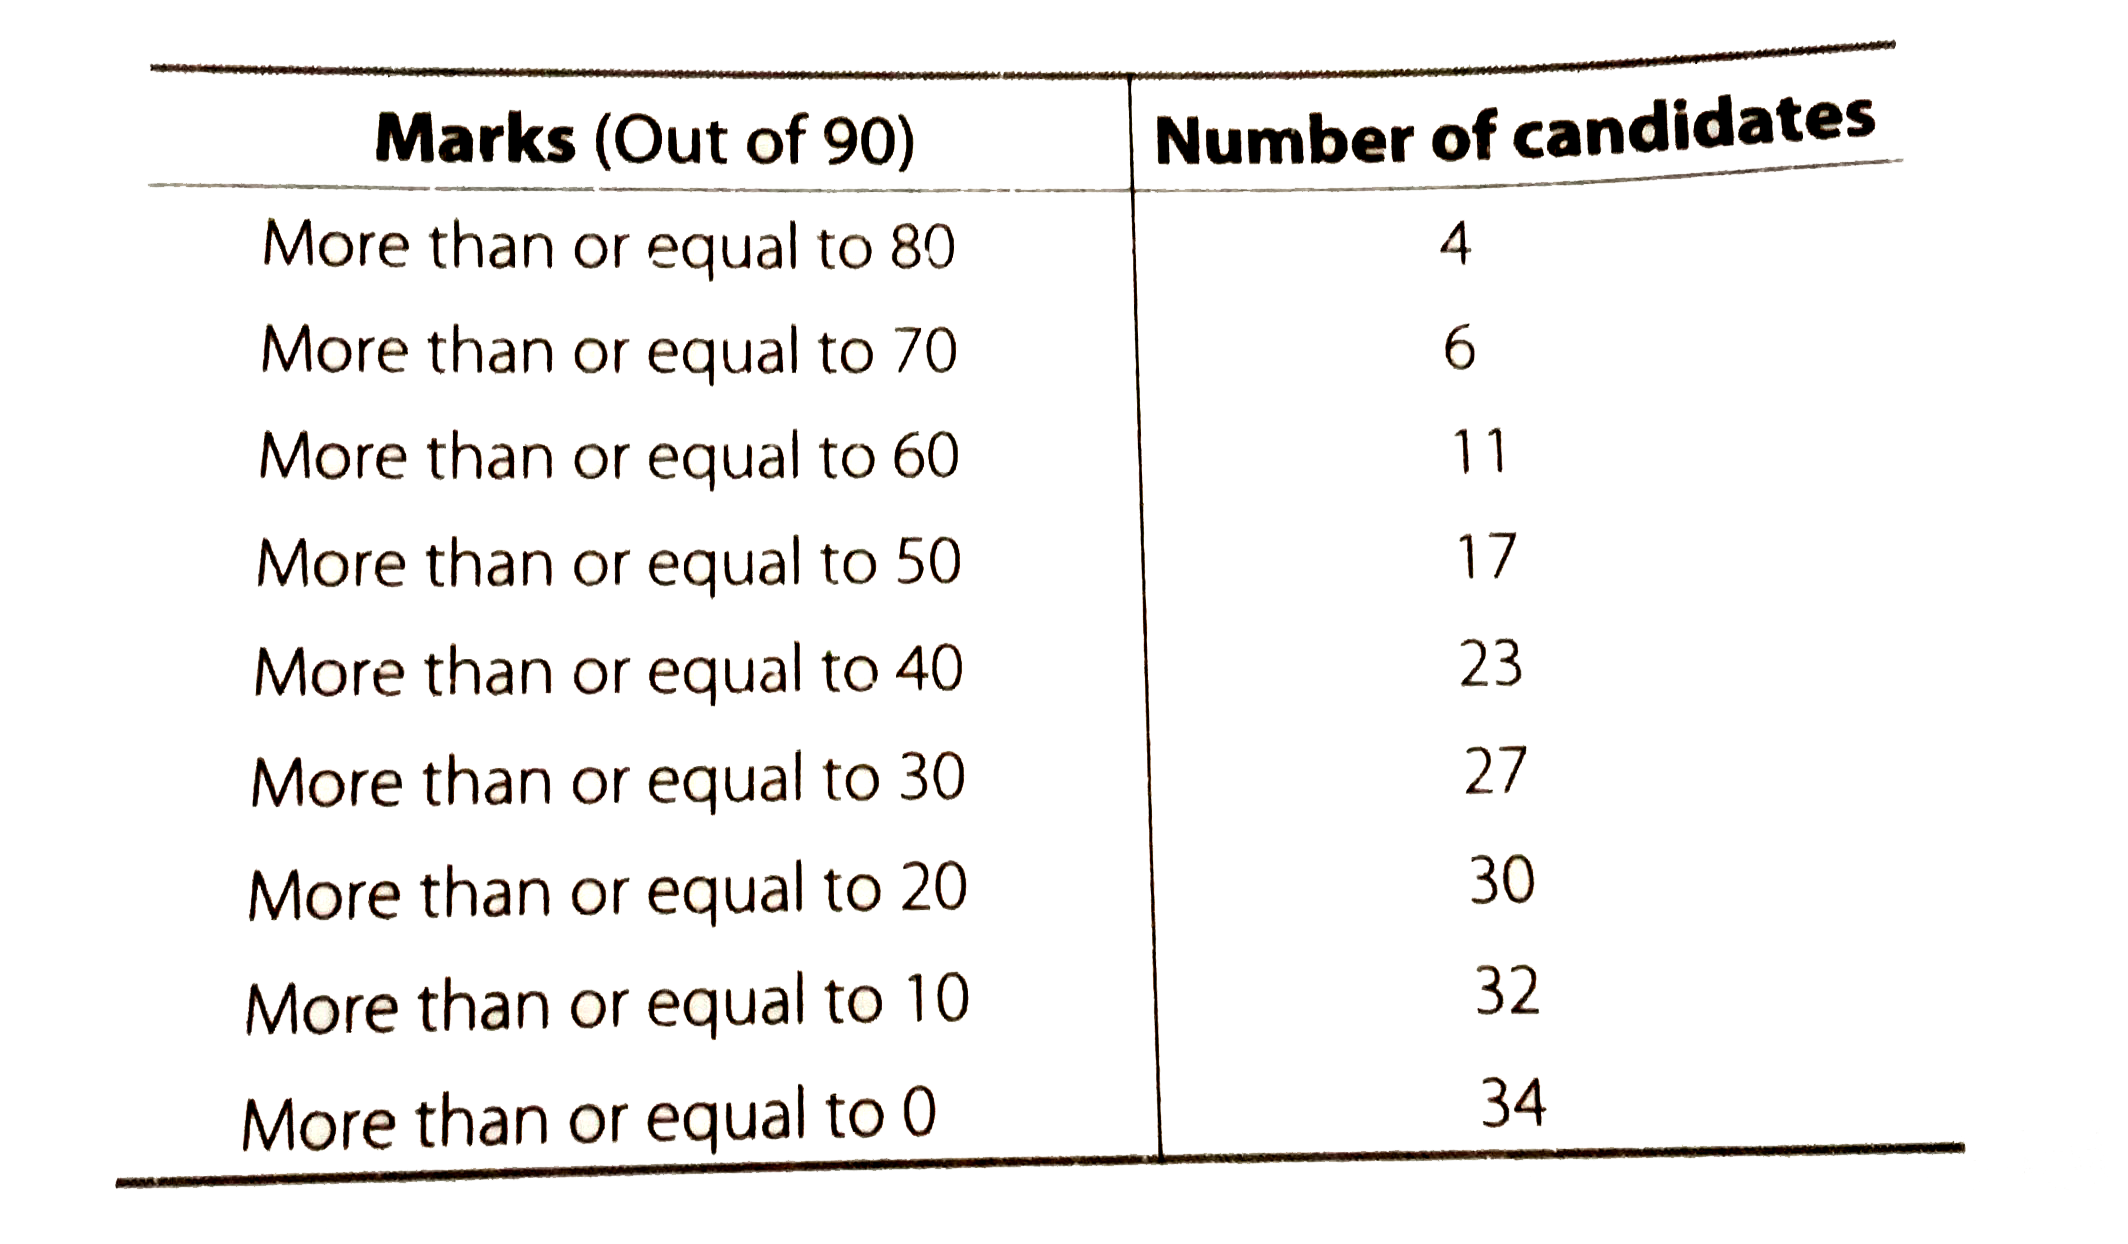
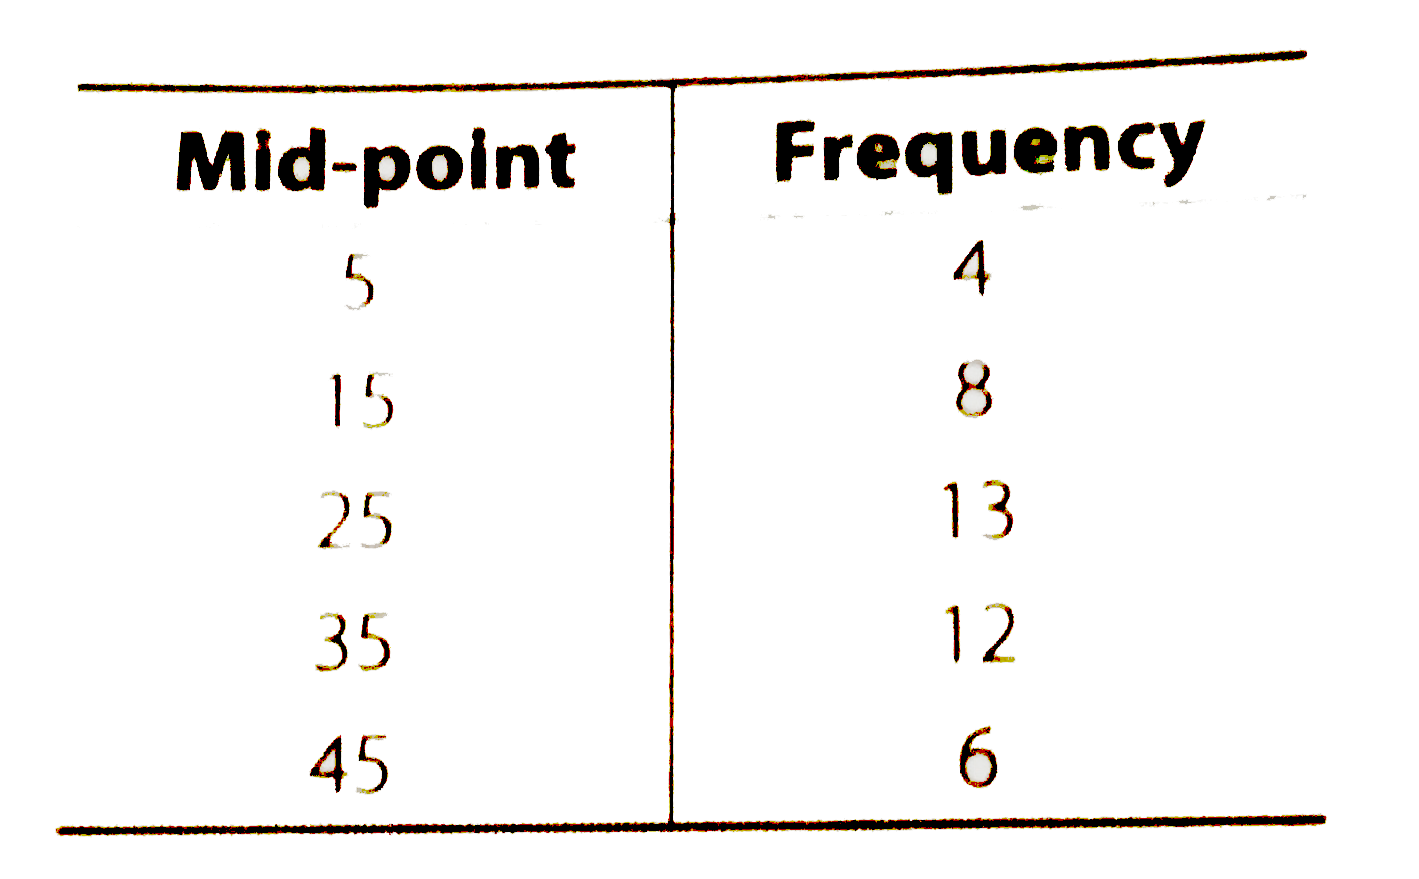
From the frequency distribution table from the following data

Step by step video & image solution for From the frequency distribution table from the following data by Maths experts to help you in doubts & scoring excellent marks in Class 12 exams.
Updated on:21/07/2023Topper's Solved these Questions
- PROBABILITYBOOK - MODERN PUBLICATIONCHAPTER - PROBABILITYEXERCISE - CHECK YOUR UNDERSTANDING
10 Videos
- PROBABILITYBOOK - MODERN PUBLICATIONCHAPTER - PROBABILITYEXERCISE - COMPETITION FILE
17 Videos
- PROBABILITYBOOK - MODERN PUBLICATIONCHAPTER - PROBABILITYEXERCISE - Exercise
5 Videos
- MATRICESBOOK - MODERN PUBLICATIONCHAPTER - MATRICESEXERCISE - CHAPTER TEST (3)
12 Videos
- RELATIONS AND FUNCTIONSBOOK - MODERN PUBLICATIONCHAPTER - RELATIONS AND FUNCTIONSEXERCISE - CHAPTER TEST (1)
12 Videos
Similar Questions
Knowledge Check
The median from the following data
 A83.17B84.08C82.17D85.67
Draw a histogram for the frequency distribution of the following data:

View SolutionPrepare a continuous grouped frequency distribution from the following data

Also, find the size of class intervals.
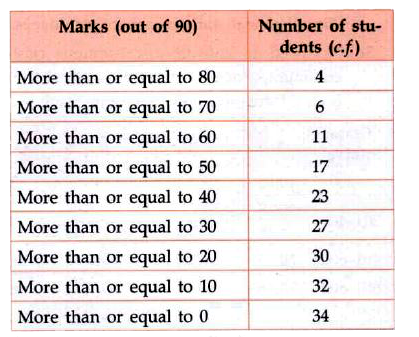
View SolutionGiven below is a cumulative frequency distribution showing the mars secured by 50 students of a class

From the frequency distribution table for the data.
View Solutionusing class intervals 1−5,6−10,11−15,........ construct the frequency distribution following data:
View SolutionMake a frequency distribution (inclusive ) series of the following data. The class interval is to be taken as 6.

View SolutionThree coins were tossed 30 times simultaneously. Each time the number of heads occurring was noted down as follows: 0 1 2 2 1 2 3 1 3 0 1 3 1 1 2 2 0 1 2 1 3 0 0 1 1 2 3 2 2 0 Prepare a frequency distribution table for the data given above.
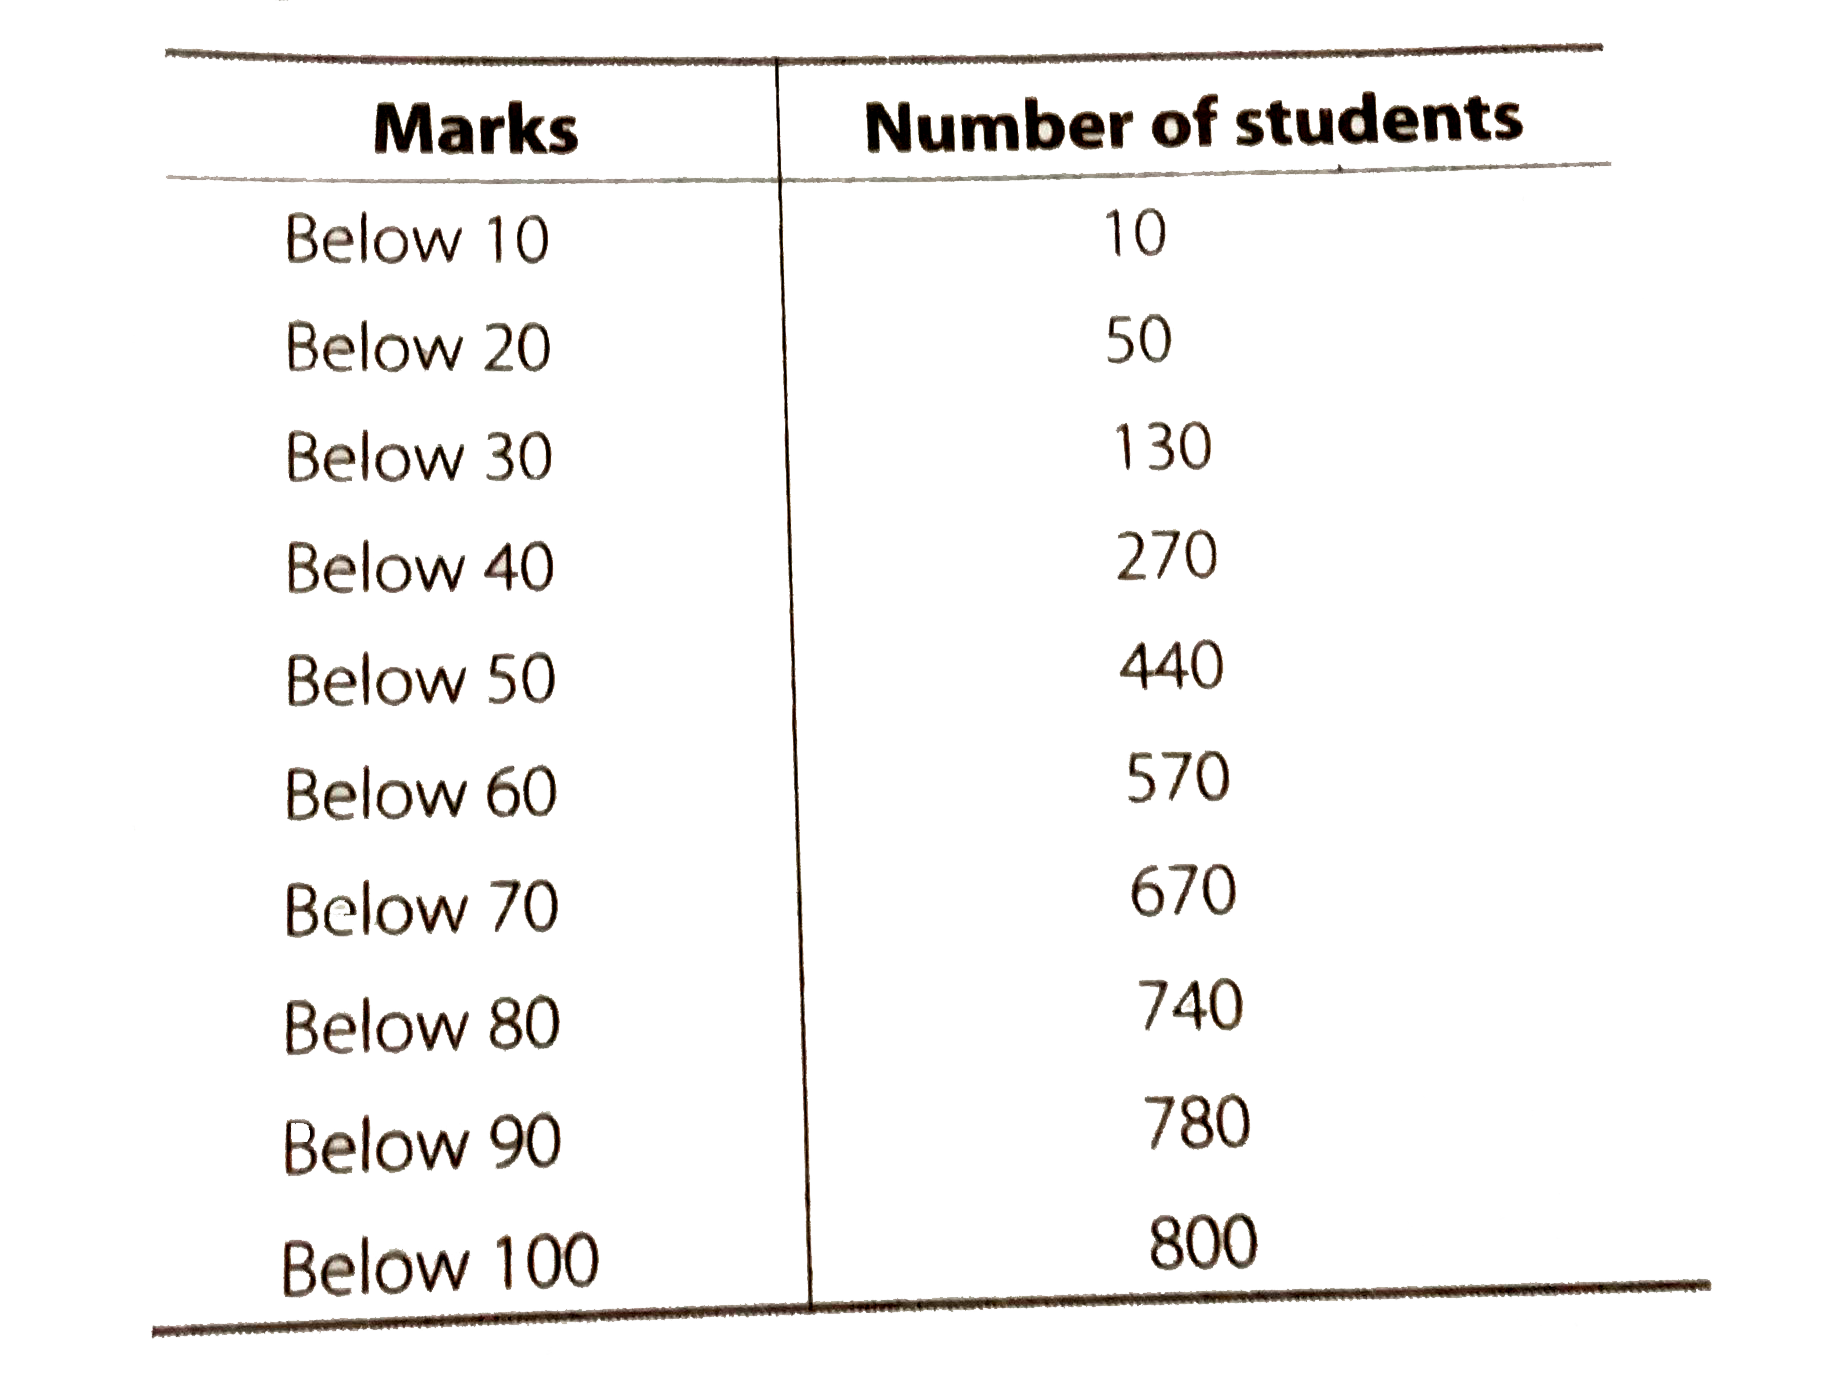
View SolutionThe following table show tha cumulative frequency distribution of marks of 800 students in an examination.

Construct a frequency distribution table for the data above.
View Solution


