From the pie graph shown alongside . Find the per cent of students that are seventh grades
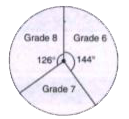
35%
40%
25%
28%
The correct Answer is:C
Step by step video, text & image solution for From the pie graph shown alongside . Find the per cent of students that are seventh grades by Maths experts to help you in doubts & scoring excellent marks in Class 7 exams.
Updated on:21/07/2023Topper's Solved these Questions
- DATA HANDLING BOOK - S CHAND IIT JEE FOUNDATIONCHAPTER - DATA HANDLING EXERCISE - Question Bank - 24 (b)
15 Videos
- DATA HANDLING BOOK - S CHAND IIT JEE FOUNDATIONCHAPTER - DATA HANDLING EXERCISE - Self Assessment Sheet - 24
10 Videos
- DATA HANDLING BOOK - S CHAND IIT JEE FOUNDATIONCHAPTER - DATA HANDLING EXERCISE - Self Assessment Sheet - 24
10 Videos
- CIRCUMFERENCE AND AREA OF A CIRCLE BOOK - S CHAND IIT JEE FOUNDATIONCHAPTER - CIRCUMFERENCE AND AREA OF A CIRCLE EXERCISE - SELF ASSESSMENT SHEET - 22
10 Videos
- DECIMALS BOOK - S CHAND IIT JEE FOUNDATIONCHAPTER - DECIMALS EXERCISE - SELF ASSESSMENT SHEET
10 Videos
Similar Questions
Find his gain per cent.
View SolutionThis graph shows the per cent of students who dropped out of school after completing High School. The point labelled A shows that, in 1996, about 4.7% of students dropped out.
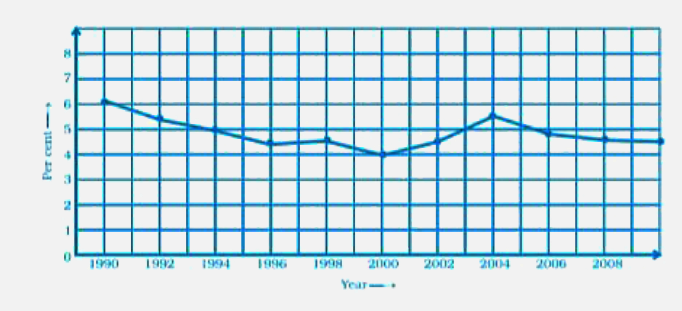
(a) In which year was the dropout the rate highest? In which year was it the lowest?
(b) When did the per cent of students who dropped out of high school first fall below 5%?
(c) About what per cent of students dropped out of high school in 2007? About what per cent of students stayed in high school in 2008?
View Solution
Knowledge Check
The Pie-graph given here shows the number of students opting different subjects in a school. If there are a total of 720 students, then by studying the pie-graph answer the questions.
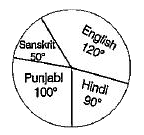
The difference in the number of students studying Hindi and Sanskrit subjects isA40B80C120D140Refer the following data table and answer the following Question.

What percent of students who choose Engineering are girls ?AA)40BB)22.86CC)50DD)100The Pie-graph given here shows the number of students opting different subjects in a school. If there are a total of 720 students, then by studying the pie-graph answer the questions.
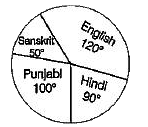
The total number of students studying English and Punjabi subjects areA220B440C110D240
Compare finding a number when a per cent of the number is known to finding the per cent of one number with that of another number.
View SolutionThe performance of 720 students in an examination for the academic year 2015-16 is shown in a pie chart. Study the pie chart carefully and answer the questions that follow.
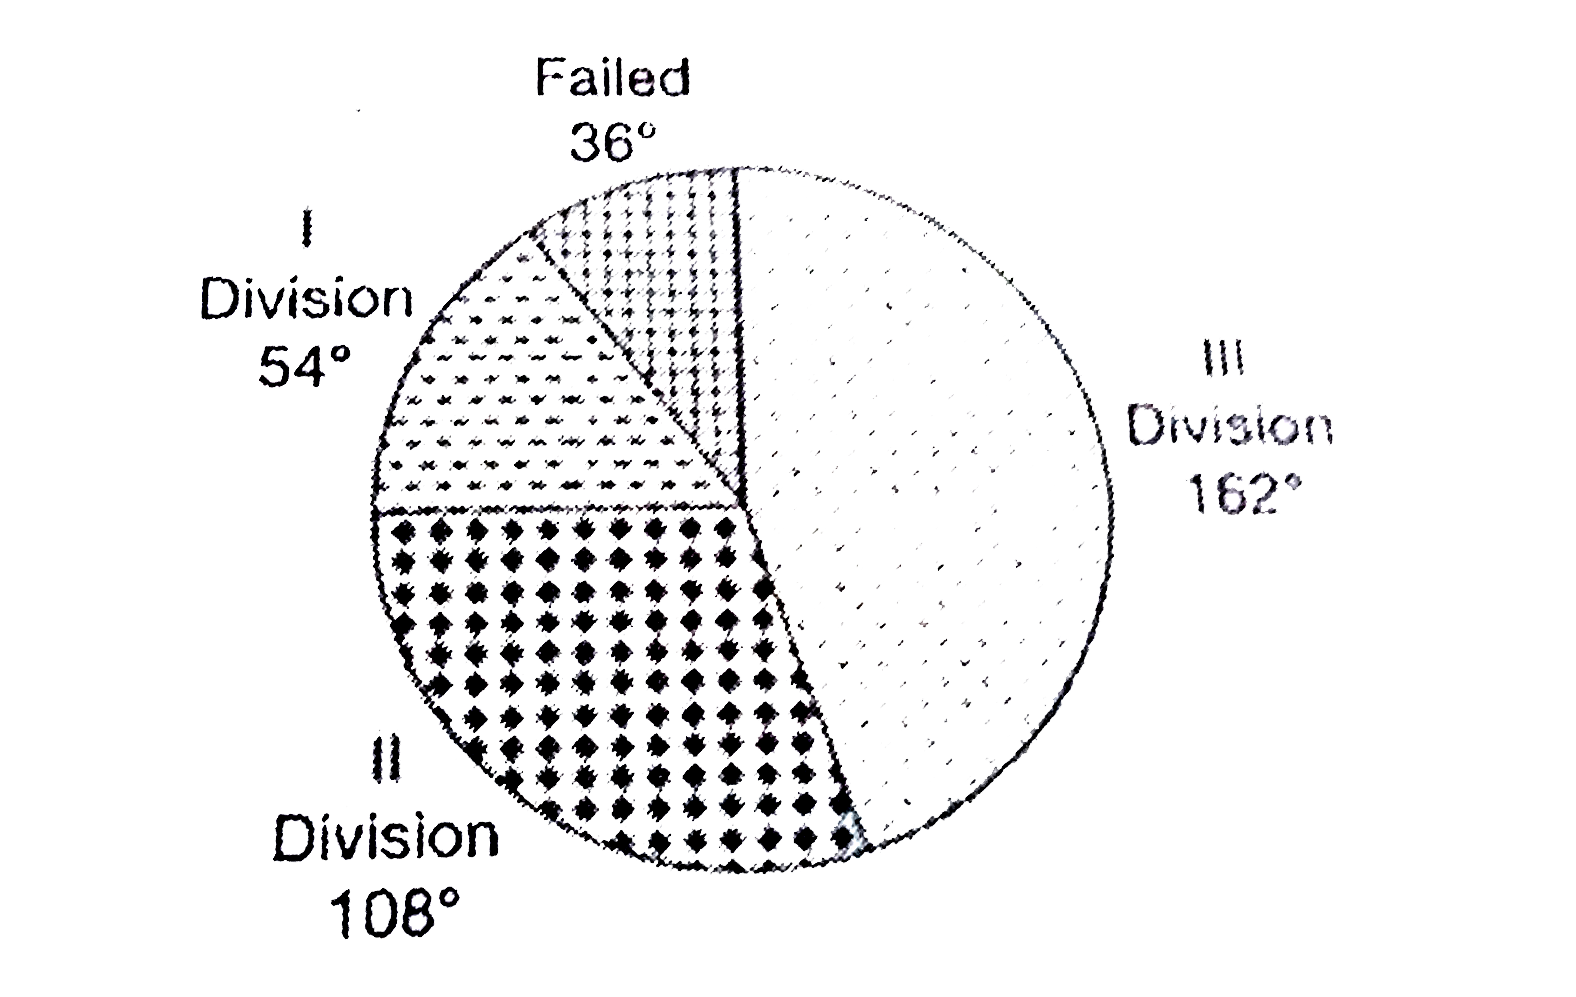
(i) Find the number of students who passed in the first division.
(ii) Find the ratio of number of students who passed to that of failed.
(iii) Find the pecentage of the number of students who failed in the examination.
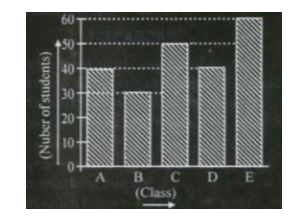
View SolutionFrom the following bar graph, find the class in which number of students are half of the other class :
View Solution150 students are studying English, Maths or both. 62 per cent of the students are studying English and 68 per cent are studying Maths. How many students are studying both?
View SolutionNumber of students from various school playing various games is given in following table
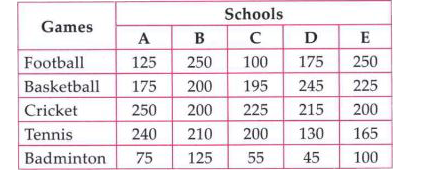
The number of students playing football from school D is what per cent of the total number of students playing all the given games from the school D ? (Round off to 2 digits after decimal )
View Solution
