This graph shows the per cent of students who dropped out of school after completing High School. The point labelled A shows that, in 1996, about 4.7% of students dropped out.
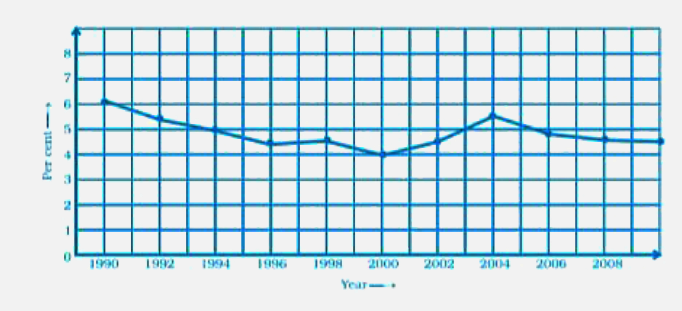
(a) In which year was the dropout the rate highest? In which year was it the lowest?
(b) When did the per cent of students who dropped out of high school first fall below 5%?
(c) About what per cent of students dropped out of high school in 2007? About what per cent of students stayed in high school in 2008?
Step by step video & image solution for This graph shows the per cent of students who dropped out of school after completing High School. The point labelled A shows that, in 1996, about 4.7% of students dropped out. (a) In which year was the dropout the rate highest? In which year was it the lowest? (b) When did the per cent of students who dropped out of high school first fall below 5%? (c) About what per cent of students dropped out of high school in 2007? About what per cent of students stayed in high school in 2008? by Maths experts to help you in doubts & scoring excellent marks in Class 8 exams.
Updated on:21/07/2023Topper's Solved these Questions
- INTRODUCTION TO GRAPHS BOOK - NCERT EXEMPLARCHAPTER - INTRODUCTION TO GRAPHS EXERCISE - THINK AND DISCUSS
4 Videos
- EXPONENTS AND POWERSBOOK - NCERT EXEMPLARCHAPTER - EXPONENTS AND POWERSEXERCISE - EXERCISE
195 Videos
- LINEAR EQUATIONS IN ONE VARIABLEBOOK - NCERT EXEMPLARCHAPTER - LINEAR EQUATIONS IN ONE VARIABLEEXERCISE - THINK AND DISCUSS
3 Videos
Similar Questions
Knowledge Check
In which year the sum of the students in two school is the highest?
A2009B2012C2011D2008The table given below shows the number of students who have taken admission in school A and B from the years 2010 to 2015.
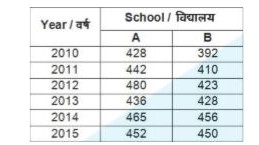
If the total student intake capacity for School B was 500 then what percentage of seats remained vacant in school B in 2015?Aa)1Bb)5Cc)10Dd)20The following pictograph shows different using conveyance by the students of a school:
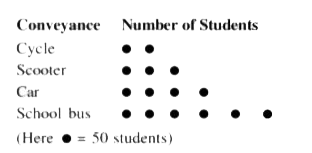
What per cent of students used school bus?A0.06B0.16C0.4D0.36
Change the statements, converting expressions into statements in ordinary language:
The number of students dropping out of school last years was m. number of students dropping out of school this years is m-30.
View SolutionOut of 600 students of a school, 126 go for a picnic. The percentage of students that did not go for the picnic is 75.
View SolutionNumber of candidates who passed in the exam from school B in the year 2005 was approximately what percent of number of students appeared in school - A in the year 2008 ?
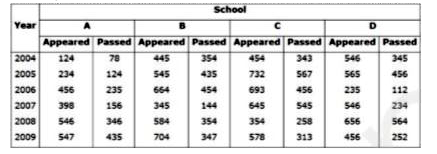
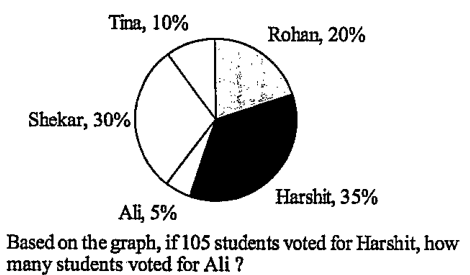
View SolutionThe student at a high school voted to elect their representative. The circle shown below represents the percent of students who voted for each candidate.
View SolutionIn which year, the absolute difference of the students in two schools is the lowest ?
View Solution
