Given below are the cumulative frequencies showing the weights of 685 students of a school. Prepare a frequency distribution table. Weight (in kg), No. of students Below 25 Below 30 Below 35 Below 40 Below 45 Below 50 Below 55 Below 60 Below 65 Below 70, 0 24 78 183 294 408 543 621 674 685
We take class-intervals 25−30,30−35,35−40,40−45,45−50,50−55,55−60,60−65and65−70.The frequency of the class 65−70 is 685−674=11,The frequency of the class 60−65 is 674−621=53 similarly the frequency of classes 55−60 is 621−543=78,50−55 is 543−408=135,45−50 is 408−294=114,40−45 is 294−183=111,35−40 is 183−78=105,30−35 is 78−24=54, and 25−30 is 24−0=24
So we get the following frequency distribution table.

Topper's Solved these Questions
Similar Questions
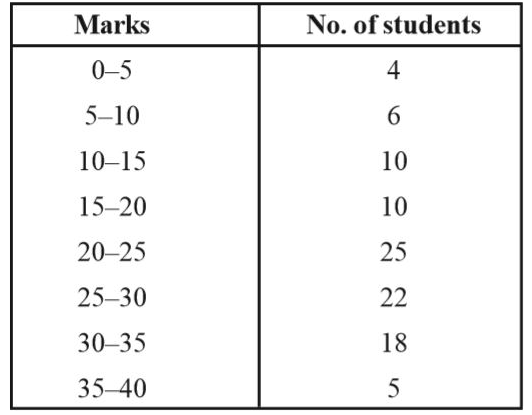
Given below is a cumulative frequency distribution showing the mars secured by 50 students of a class

From the frequency distribution table for the data.
View SolutionGiven below is a cumulative frequency distribution showing the mars secured by 50 students of a class

From the frequency distribution table for the data.
View SolutionGiven below is the frequency distribution of the heights of playces in a school :

Find the modal height
View SolutionGiven below is the frequency distribution of the heights of playces in a school :

Find the modal height
View SolutionThe distribution given below show the marks of 100 students of a class:
then find Ogive medium of data
View SolutionA cumulative frequency distribution is given below. Convert this into a frequency distribution table. Marks Below 45 Below 60 Below 75 Below 90 Below 105 Below 120 No. of Students 0 8 23 48 85 116
View SolutionA cumulative frequency distribution is given below. Convert this into a frequency distribution table. Marks Below 45 Below 60 Below 75 Below 90 Below 105 Below 120 No. of Students 0 8 23 48 85 116
View SolutionA cumulative frequency distribution is given below. Convert this into a frequency distribution table. Marks Below 45 Below 60 Below 75 Below 90 Below 105 Below 120 No. of Students 0 8 23 48 85 116
View SolutionFind the mean marks of the students from the following cumulative frequency distribution: Marks: Below Below Below Below Below Below Below Below Below Below 10 20 30 40 50 60 70 80 90 100 No. of Students 5 9 17 29 45 60 70 78 83 85
View SolutionFind the mean of the frequency distribution:

(ii) The weight of 40 students of class IX are given below:

View Solution
