Given line graph shows the marks scored by Raghav in each subject in exams. Study the graph carefully and answer the following questions.
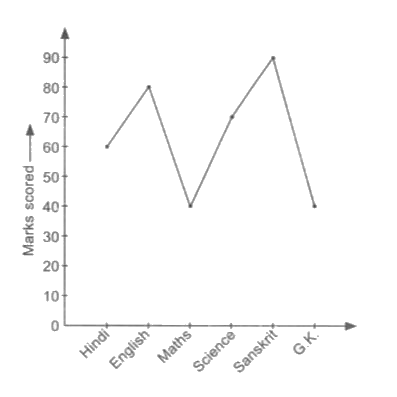
In which subject he got second highest marks ?
Sanskrit
Maths
English
G.K
The correct Answer is:A
Step by step video & image solution for Given line graph shows the marks scored by Raghav in each subject in exams. Study the graph carefully and answer the following questions. In which subject he got second highest marks ? by Maths experts to help you in doubts & scoring excellent marks in Class 6 exams.
Topper's Solved these Questions
- BOOK - SCIENCE OLYMPIAD FOUNDATION CHAPTER - DATA HANDLINGEXERCISE - Achievers section (Hots)5videos
DATA HANDLING
- BOOK - SCIENCE OLYMPIAD FOUNDATION CHAPTER - CLASS 6 SAMPLE PAPER FINAL 4EXERCISE - Section A- Mathematics10videos
CLASS 6 SAMPLE PAPER FINAL 4
- BOOK - SCIENCE OLYMPIAD FOUNDATION CHAPTER - DECIMALS EXERCISE - Achievers Section (Hots)5videos
DECIMALS
Similar Questions
Given below is a bar graph showing the marks obtained by Tarun in few subjects in an annual examination. Read the bar graph carefully and answer the question given below : In which subject does Taun get the lowest marks ? In which subject does Tarun get the highest marks ? How many marks does he get in English ? In which subjects does Tarun get less than 50 marks ?
View SolutionFollowing graph shows the income of a company in six different years. Study the graph , carefully and answer the questions that follow.
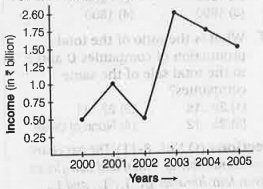
In which year income of the company is the highest?View Solution
Knowledge Check
- Question 1 - Select One
Study the following table carefully and answer the questions given below-

Who amongst them secured highest percentage of marks?AChiragBEhsanCAmitDBhavna - Question 2 - Select One
The bar graph shows average marks scored in a 100 mark English exam by students of 7 divisions of standard X. Study the diagram and answer the following questions.
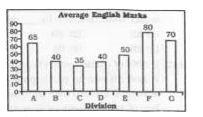
Which division scored the second highest average marks?AFBBCGDD - Question 3 - Select One
The bar graph shows average marks scored in a 100 mark English exam by students of 7 divisions of standard X. Study the diagram and answer the following questions.

Which division scored the second highest average marks?AFBBCADC
Table given below shows marks obtained by four students in four different subjects in an exam. Study the data carefully and answer the following questions.
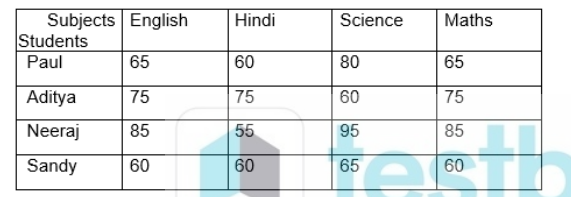
Total marks scored by Paul are how much more/less than total marks scored by Neeraj?View SolutionGiven bar graph shows the number of books of difference subjects kept in a library. Study it and answer the following questions :
Which subject has minimum number of books in the library ?View SolutionThe bar graph shows average marks scored in a 100 marks History exam by students of 7 divisions of Standard x. Study the diagram and answer the following questions.
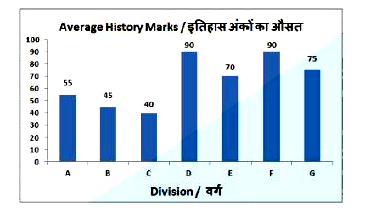
Which division scored the second lowest marks ?View SolutionThe bar graph shows average marks scored in a 100 marks Science exam by student of 7 divisions of Standard X. Study the diagram and answer the following questions.
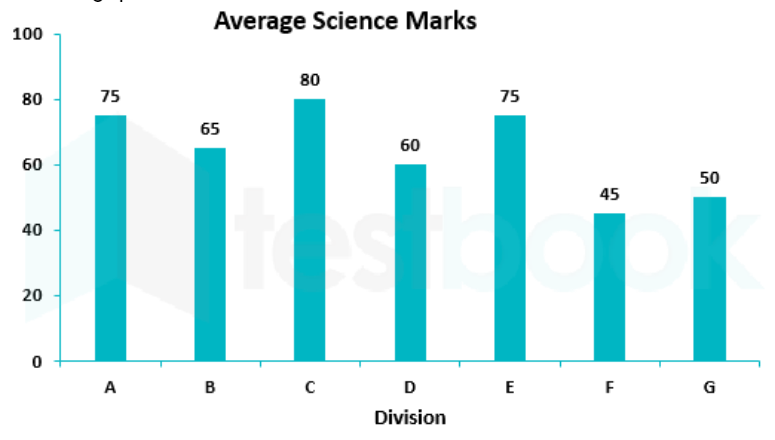
Which division scored the second lowest marks?View SolutionThe bar graph shows average marks scored in a 100 mark Science exam by students of 7 divisions of Standard X. Study the diagram and answer the following questions.
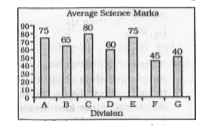
Marks of division F were lesser than that of Division C byView Solution

