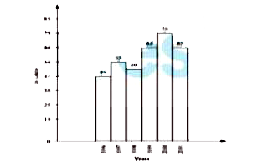
Following graph shows the income of a company in six different years. Study the graph , carefully and answer the questions that follow.
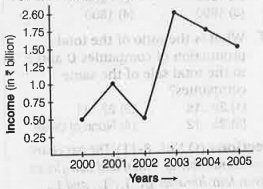
In which year income of the company is the highest?
2001
2002
2003
2004
Step by step video & image solution for Following graph shows the income of a company in six different years. Study the graph , carefully and answer the questions that follow. In which year income of the company is the highest? by Maths experts to help you in doubts & scoring excellent marks in Class 14 exams.
Similar Questions
Following graph shows the income of a company in six different years. Study the graph , carefully and answer the questions that follow.
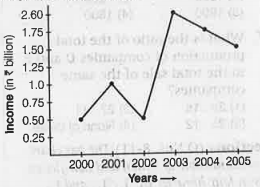
What is the ratio of the income of the company in the years 2000 and 2005 ?View SolutionFollowing graph shows the income of a company in six different years. Study the graph , carefully and the questions that follow.
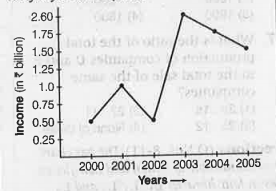
Find the percentage decrease in income from 2001 to 2002.View Solution
Knowledge Check
- Question 1 - Select One
The following line graph shows the ratio of imports and exports of a company during a period of 1995-2001. Study the graph carefully and answer the questions.
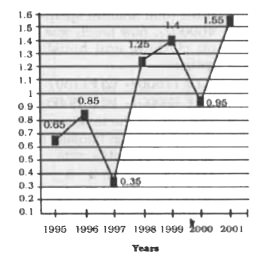
In which year was the ratio of imports to exports maximum ?A2000B1998C1996D2001 - Question 2 - Select One
The following graph represents the annual percentage profit earned by a company during the pe.riod 1996 - 2001. Study the graph carefully and answer the questions that follow .
The profit earned by the company is maximum in the year:A1999B2001C1996D2000
Following bar graph shown the income and expenditure ( in Rs. lakhs) of a ceremony. Read the graph carefully and answer the questions.
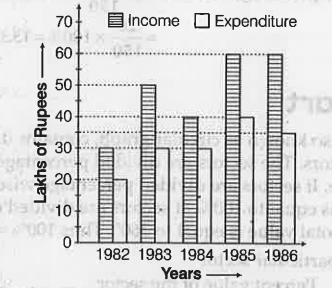
What is the average income of the company are the years?View SolutionThe following graph given the annual percent profit earned by a company during the period 1996-2001. Study the graph carefully and answer the questions that follow.
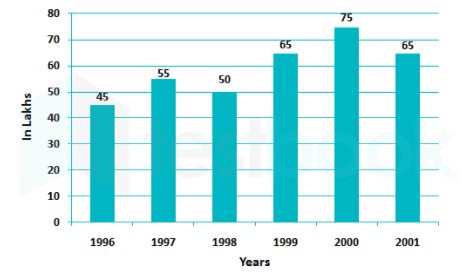
The expenditure of the company during the year 1996 was 30 crores. The income of the company in that year was (in crores ):View SolutionThe following graph given the annual percent profit earned by a comppany during the period 1996-2001. Study the graph carefully and answer the questions that follow.
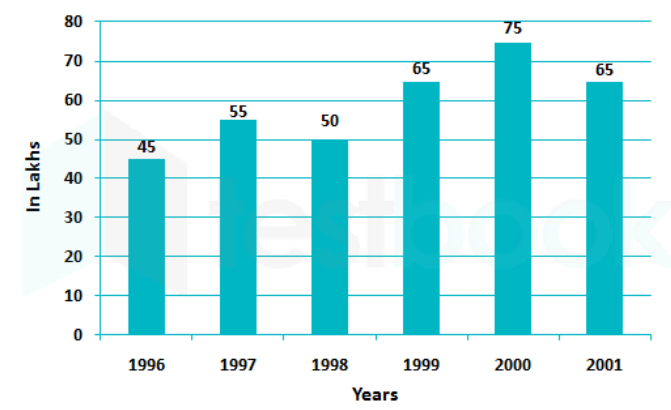
The perofit earned by the company is maximum is the year :View SolutionThe following graph given the annual percent profit earned by a company during the period 1996-2001. Study the graph carefully and answer the questions that follow.
Profit=Income - Expenditure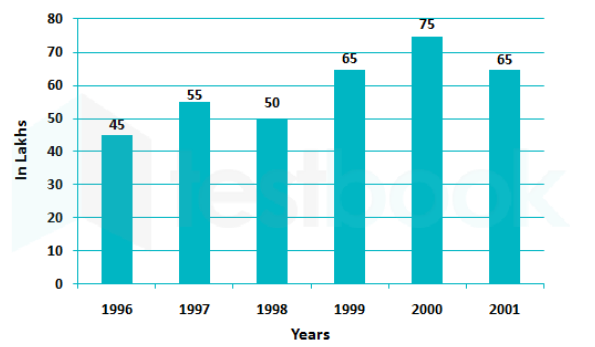
The expenditure of the company during the year 1996 was Rs 30 Lakhs. The income of the company in that year was (in Lakhs Rs):View SolutionIn the given bar graph , the white bar shows the income and the black bar shows the expenditure of company (in Rs. Lakhs) . Study the graph and answer the question that follows .
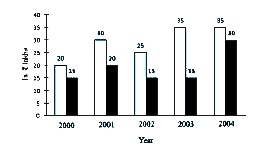
The percentage decrease in the income of the company in 2002 as compared to that in 2001 is :View SolutionRead the following graph carefully and answer the questions given below.
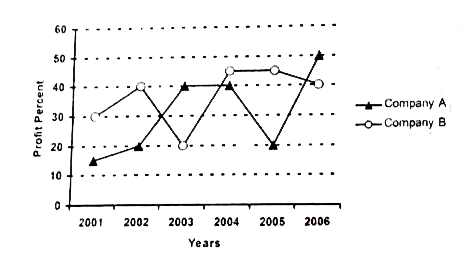
In which year the average of the profit percent of the both companies was the maximum ?View Solution

