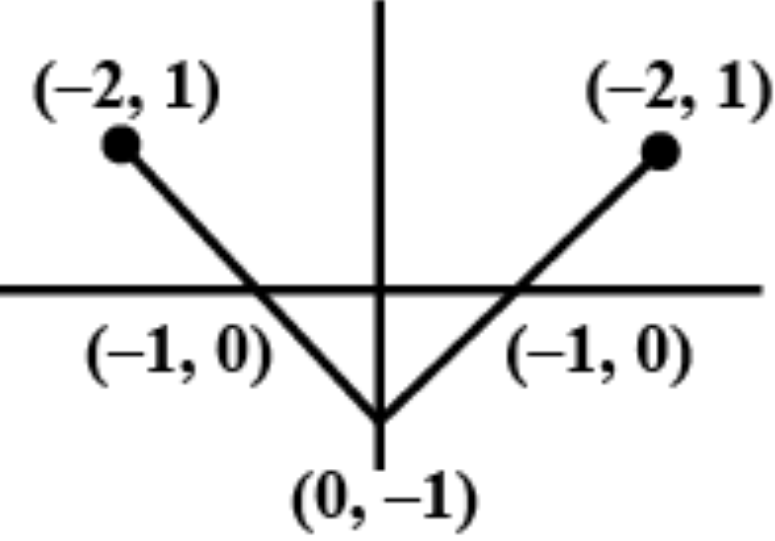
Graph function. y=|x+2|+x
The correct Answer is:(##SCHOPMISCMATXIC02E07006_A01##)
To graph the function y=|x+2|+x, we will follow these steps:
Step 1: Analyze the Absolute Value
The expression |x+2| changes based on the value of x. We need to determine the point where the expression inside the absolute value equals zero:
x+2=0⟹x=−2
This divides our analysis into two cases: when x≥−2 and when x<−2.
Step 2: Define the Function for Each Case
1. Case 1: x≥−2
- Here, |x+2|=x+2.
- Therefore, the function becomes:
y=(x+2)+x=2x+2
2. Case 2: x<−2
- Here, |x+2|=−(x+2)=−x−2.
- Therefore, the function becomes:
y=(−x−2)+x=−2
Step 3: Write the Piecewise Function
We can now write the function as a piecewise function:
y={2x+2if x≥−2−2if x<−2
Step 4: Plot the Graph
1. For x≥−2:
- The line y=2x+2 has a slope of 2 and a y-intercept of 2.
- At x=−2, y=2(−2)+2=−2.
- As x increases, the line will rise steeply.
2. For x<−2:
- The line y=−2 is a horizontal line at y=−2.
Step 5: Identify Key Points
- The point where the two cases meet is at (−2,−2).
- For x<−2, the function remains constant at y=−2.
- For x=−1, substituting into the first case gives y=2(−1)+2=0.
Step 6: Draw the Graph
- Draw the horizontal line y=−2 for x<−2.
- Draw the line y=2x+2 starting from the point (−2,−2) and extending to the right.
Final Graph
The graph consists of a horizontal line at y=−2 for x<−2 and a line with a positive slope starting from the point (−2,−2) for x≥−2.
---
The expression |x+2| changes based on the value of x. We need to determine the point where the expression inside the absolute value equals zero:
x+2=0⟹x=−2
This divides our analysis into two cases: when x≥−2 and when x<−2.
1. Case 1: x≥−2
- Here, |x+2|=x+2.
- Therefore, the function becomes:
y=(x+2)+x=2x+2
- Here, |x+2|=−(x+2)=−x−2.
- Therefore, the function becomes:
y=(−x−2)+x=−2
We can now write the function as a piecewise function:
y={2x+2if x≥−2−2if x<−2
1. For x≥−2:
- The line y=2x+2 has a slope of 2 and a y-intercept of 2.
- At x=−2, y=2(−2)+2=−2.
- As x increases, the line will rise steeply.
- The line y=−2 is a horizontal line at y=−2.
- The point where the two cases meet is at (−2,−2).
- For x<−2, the function remains constant at y=−2.
- For x=−1, substituting into the first case gives y=2(−1)+2=0.
- Draw the horizontal line y=−2 for x<−2.
- Draw the line y=2x+2 starting from the point (−2,−2) and extending to the right.
The graph consists of a horizontal line at y=−2 for x<−2 and a line with a positive slope starting from the point (−2,−2) for x≥−2.
Topper's Solved these Questions
- BOOK - ICSECHAPTER - RELATIONS AND FUNCTIONSEXERCISE - EXERCISE 2 (f)29videos
RELATIONS AND FUNCTIONS
- BOOK - ICSECHAPTER - RELATION AND FUNCTIONSEXERCISE - MULTIPLE CHOICE QUESTIONS (Choose the correct answer from the given four options in questions)32videos
RELATION AND FUNCTIONS
- BOOK - ICSECHAPTER - SAMPLE QUESTION PAPER 01EXERCISE - SECTION C8videos
SAMPLE QUESTION PAPER 01
Similar Questions
Graph each function. y=|x|+x,−2≤x≤2
View Solutiondraw the graph of function. y=|x|−x2
View SolutionDraw the graph of function y=|2−|x−2∣∣.
View SolutionDraw the graph of function. y=1|x|
View SolutionDraw the graph of function. y=∣∣4−x2∣∣,−3≤x≤3.
View SolutionDraw the graph of the function y=|x−2|+|x−3|
View SolutionDraw the graph of the function y=|x−2|+|x−3|
View SolutionThe graph of the function y=f(x). Then which of the following curve represent the graph of the function y=|f(x)|
 View Solution
Graph the function xy−y−x−2=0.
View SolutionDraw the graph of the function y=[x] in −2<x<4
View Solution

