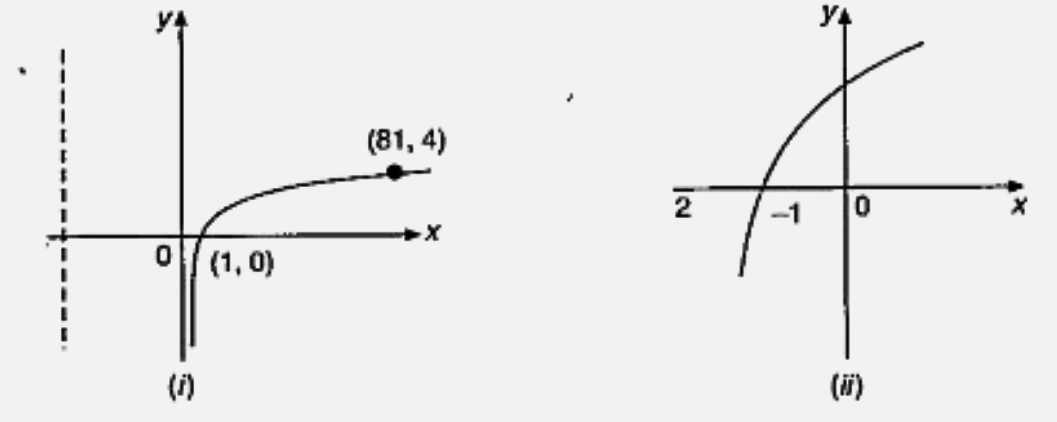
Diagram (ii) shows the curve y=log10(x+p). What is the value of p?

The correct Answer is:2
Step by step video & image solution for Diagram (ii) shows the curve y=log_(10)(x+p). What is the value of p? by Maths experts to help you in doubts & scoring excellent marks in Class 11 exams.
Updated on:21/07/2023Topper's Solved these Questions
- RELATIONS AND FUNCTIONSBOOK - ICSECHAPTER - RELATIONS AND FUNCTIONSEXERCISE - EXERCISE 2 (f)
29 Videos
- RELATION AND FUNCTIONSBOOK - ICSECHAPTER - RELATION AND FUNCTIONSEXERCISE - MULTIPLE CHOICE QUESTIONS (Choose the correct answer from the given four options in questions)
32 Videos
- SAMPLE QUESTION PAPER 01BOOK - ICSECHAPTER - SAMPLE QUESTION PAPER 01EXERCISE - SECTION C
8 Videos
Similar Questions
Knowledge Check
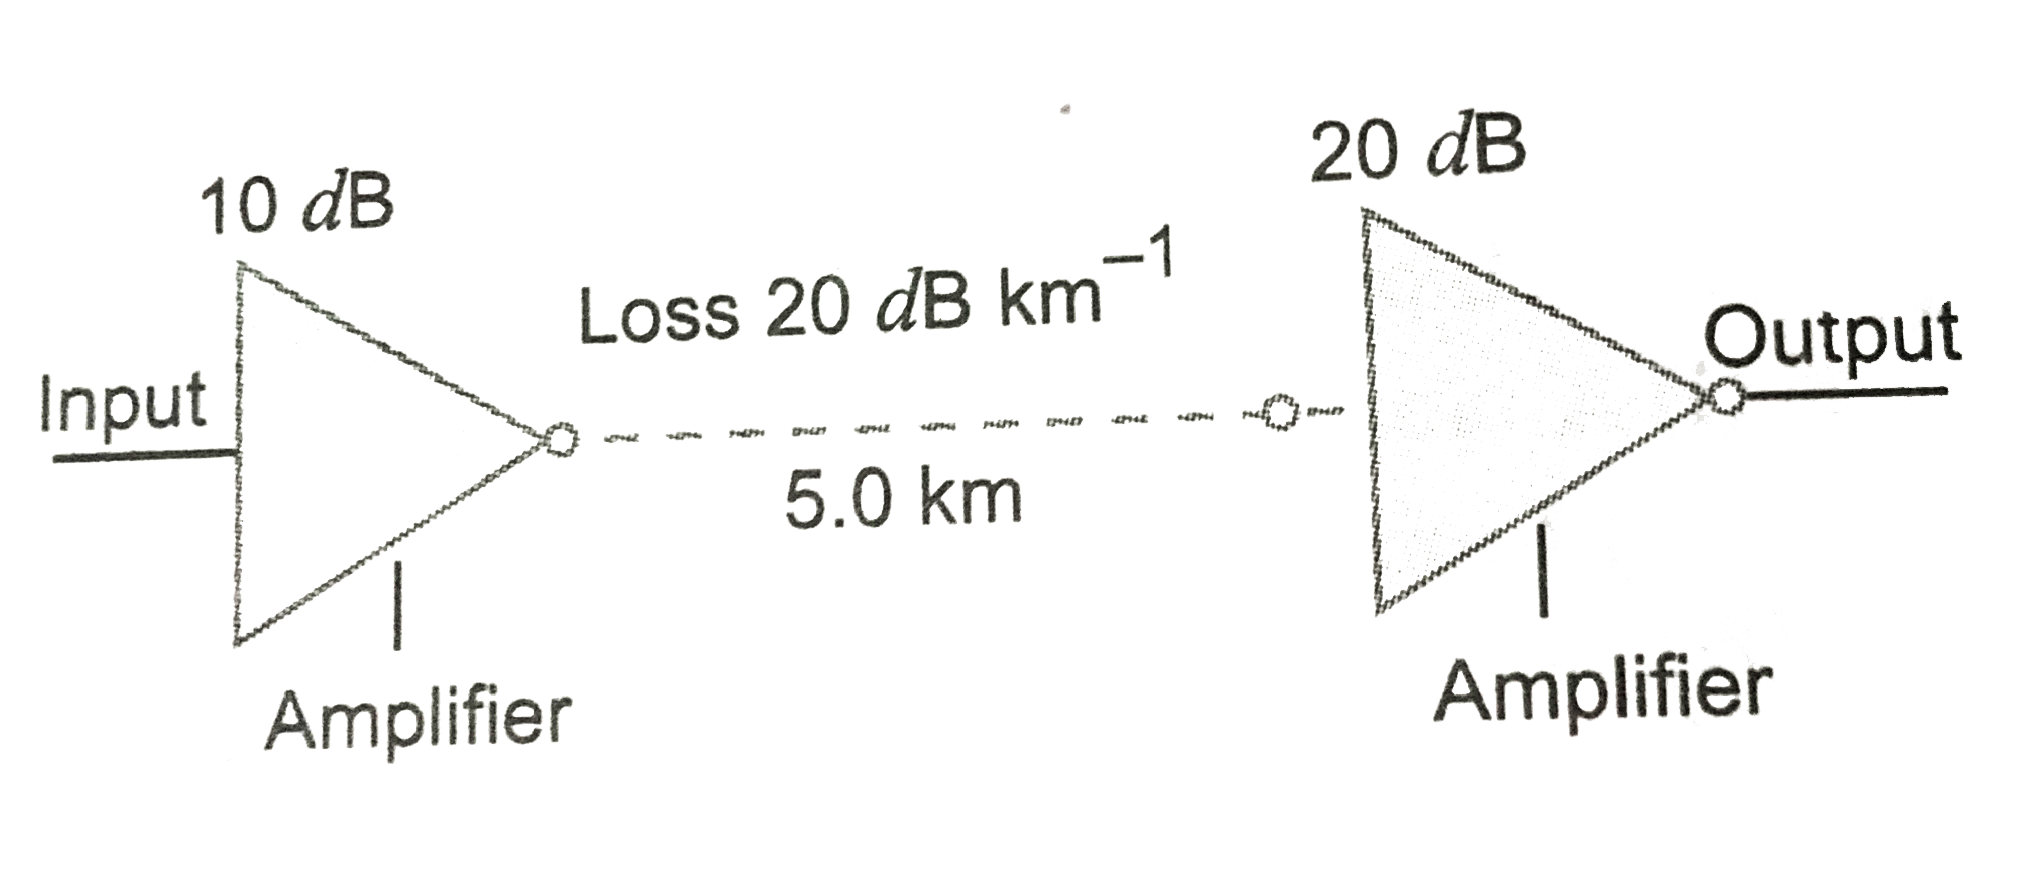
Figure shows a communication system. What is the output power when input is 1.01 mW? (Gain in dB=10log10PoPi)
 A90mWB101mWC1112mWD120mW
Sketch the curve y=log|x|
View SolutionIf y=log10x, then the value of dydx is
View SolutionIf y=22p−1andz=p−2, what is the value of yz when p=2.5?
View SolutionWhen the tangent the curve y=x log (x) is parallel to the chord joining the points (1,0) and (e,e) the value of x , is
View SolutionP is a variable point on the curve y= f(x) and A is a fixed point in the plane not lying on the curve. If PA2 is minimum, then the angle between PA and the tangent at P is
View SolutionCosine of the acute angle between the curve y=3x−1logex and y=xx−1, at the point of intersection (1,0) is
View SolutionFigure (EP) shows a communication system. What is the output power when input signals is of 1.01 mW? [ gain in dB=10log10(P0/Pt)].

View Solution

 .
.