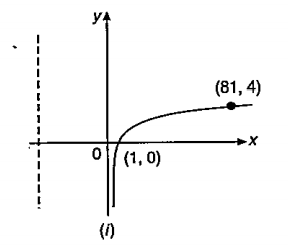
Diagram (i) shows the curve . What is the value of a?
 .
.
Text Solution
The correct Answer is:3
|
Topper's Solved these Questions
- RELATIONS AND FUNCTIONSBOOK - ICSECHAPTER - RELATIONS AND FUNCTIONSEXERCISE - EXERCISE 2 (f)
29 Videos
- RELATION AND FUNCTIONSBOOK - ICSECHAPTER - RELATION AND FUNCTIONSEXERCISE - MULTIPLE CHOICE QUESTIONS (Choose the correct answer from the given four options in questions)
32 Videos
- SAMPLE QUESTION PAPER 01BOOK - ICSECHAPTER - SAMPLE QUESTION PAPER 01EXERCISE - SECTION C
8 Videos
Similar Questions
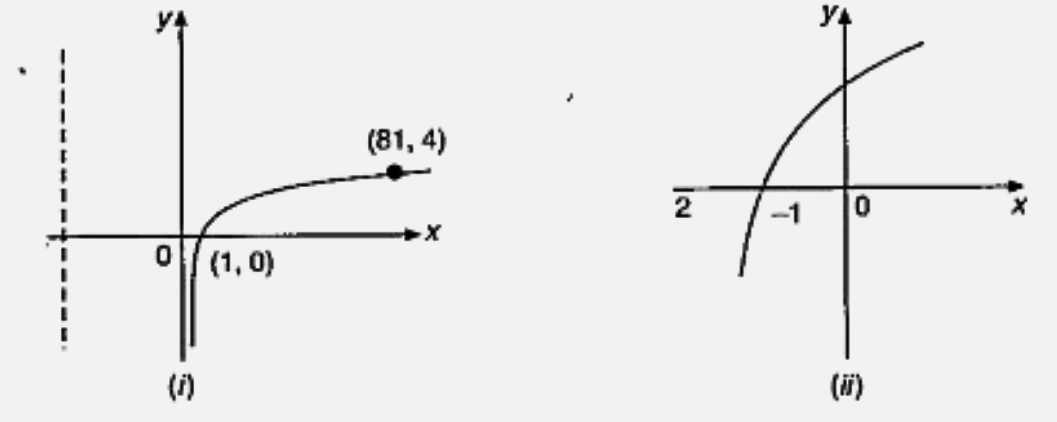
Diagram (ii) shows the curve y=log10(x+p). What is the value of p?

View SolutionPlot the curve y=(log)e(−x).
View SolutionSketch the curve y=log|x|
View SolutionSketch the curve y=log|x|
View SolutionSketch the curve y=log|x|
View SolutionPlot the curve y=(log)e(−x).
View SolutionPlot the curve y=(log)e(−x).
View SolutionIf (logxx)(log32x)(log2xy)=logxx2, then what is the value of y ?
View SolutionIf y=x1m, show that m=logyx.
View SolutionIf log2(a3b)=x and log2(3ab)=y what is the value of log2a ?
View Solution
