Graph of y=f(x) is given as shown in the following figure. Draw the graph of y=sgn(f(x)).
Video Solution
Text Solution
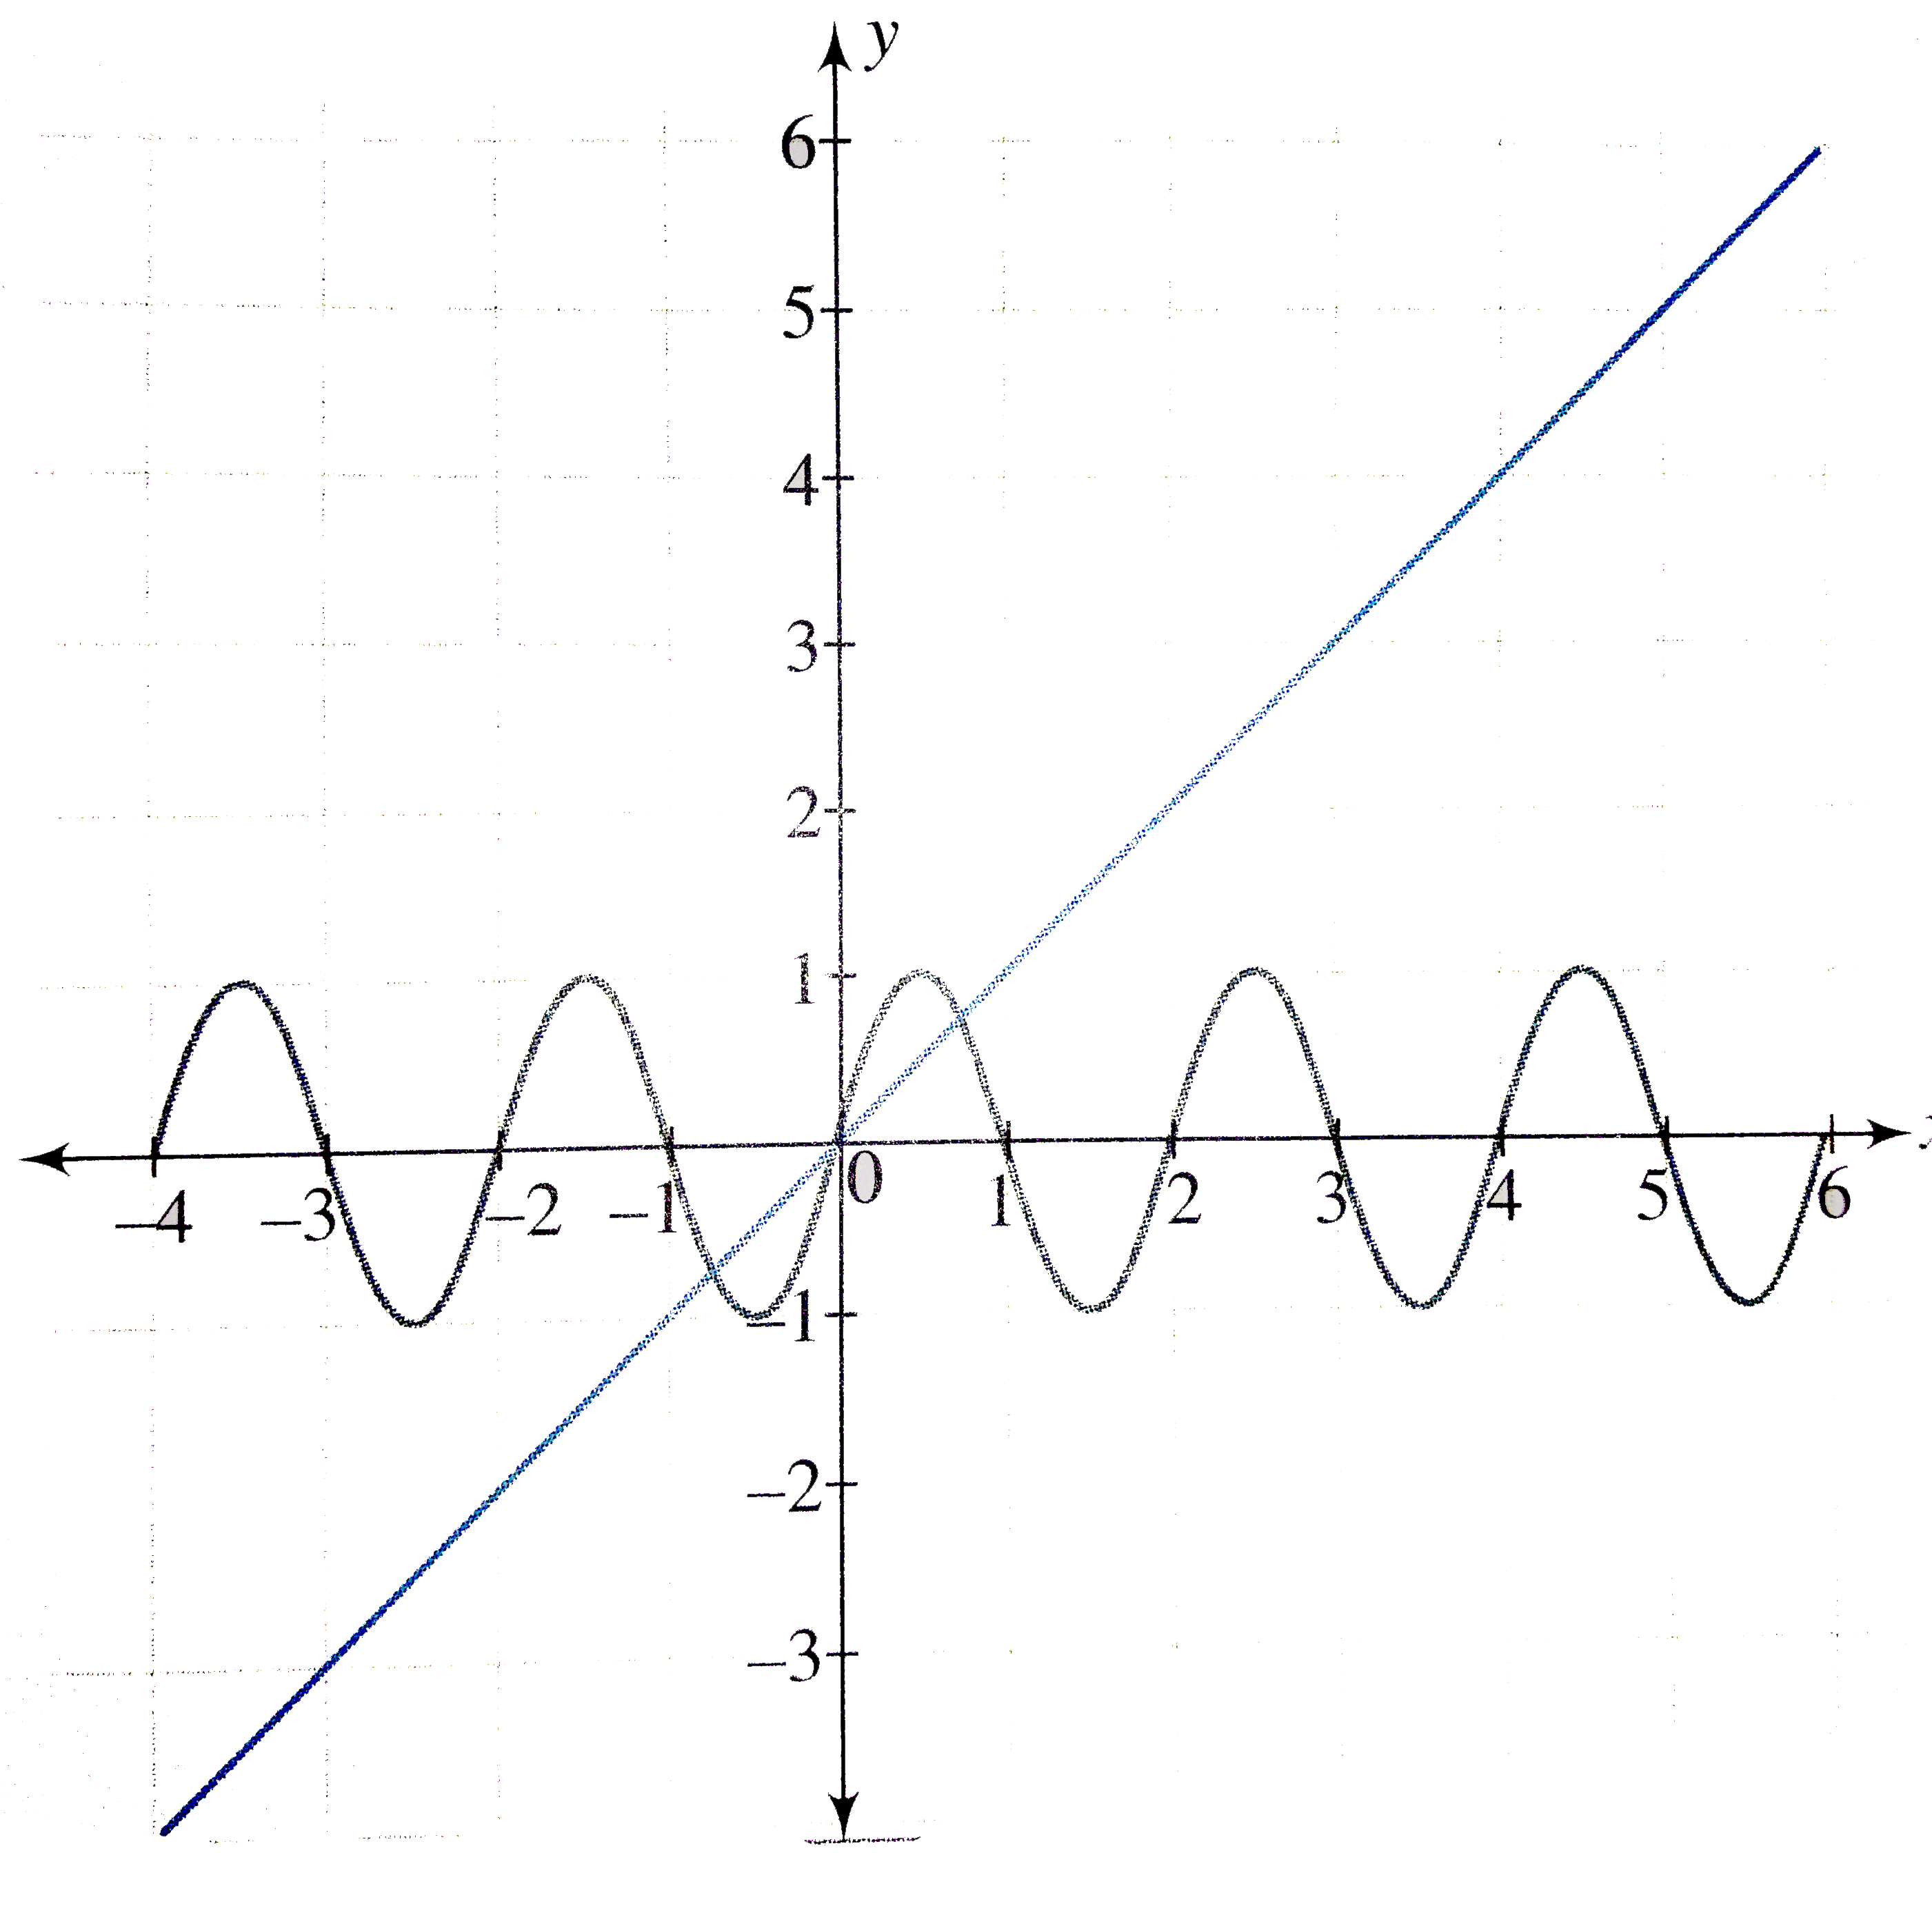
Draw the line y=x on the given graph y=f(x).

From the figure, xf(x)>0 for x∈(−3,−2)∪(−1,0)∪(0,1)∪(2,3)∪(4,5)andxf(x)<0 for x∈(−4,−3)∪(−2,−1)∪(1,2)∪(3,4)∪(5,6)
xf(x)=0 for x=−4,−3,−2,−1,0,1,2,3,4,5,6
Thus, the graph of y=f(x)=sgn(xf(x)) is as follows.

|
Topper's Solved these Questions
- GRAPHS OF ELEMENTARY FUNCTIONS BOOK - CENGAGECHAPTER - GRAPHS OF ELEMENTARY FUNCTIONS EXERCISE - Exercise
34 Videos
- GRAPHS OF POLYNOMIAL AND RATIONAL FUNCTIONSBOOK - CENGAGECHAPTER - GRAPHS OF POLYNOMIAL AND RATIONAL FUNCTIONSEXERCISE - Exercise
13 Videos
- GRAPHS OF TRIGONOMETRIC FUNCTIONSBOOK - CENGAGECHAPTER - GRAPHS OF TRIGONOMETRIC FUNCTIONSEXERCISE - Exercise
22 Videos
Similar Questions
Draw the graph of y=−x
View SolutionDraw the graph of y=|x|
View SolutionThe graph of y=f(x) is as shown in the following figure. Draw the graph of y=[f(x)].

View SolutionGraph of y=f(x) is given, then
View SolutionDraw the graph of f(x)=sgn(x−2).
View SolutionDraw the graph of f(x)=sgn(x3−x).
View SolutionThe graph of the function y=f(x) is as shown in the figure.

Then draw the graphs of
(i) |y|=sgn(f(x)) (ii) |y|=|f(x∣)|
(iii) y=xsgn(f(x))
View SolutionDraw the graph of f(x)=sgn(logex).
View SolutionDraw the graph of:
y=f(x)=3sin(2x−1).
View SolutionGraph of y=f(x) is as shown in the following figure.

Find the roots of the following equations
f(x)=0
f(x)=4
f(x)=x+2
View Solution