If the monthly expenditure pattern of a person who earns a monthly salary of Rs. 15,000 is represented in a pie graph, then the sector angle of an item on transport expenses measures 15∘. What is his monthly expenditure on transport ?
Rs. 450
Rs. 625
Rs. 675
Cannot be computed from the iven data.
The correct Answer is:B
To find the monthly expenditure on transport based on the given information, we can follow these steps:
Step 1: Understand the relationship between the sector angle and total angle
The total angle in a pie chart is 360 degrees. The angle representing transport expenses is given as 15 degrees.
Step 2: Set up the proportion
We can set up a proportion to find the expenditure on transport. The formula to calculate the expenditure based on the angle is:
Expenditure on Transport=(Sector AngleTotal Angle)×Total Expenditure
Step 3: Substitute the values into the formula
Here, the sector angle for transport expenses is 15 degrees, the total angle is 360 degrees, and the total monthly salary (or expenditure) is Rs. 15,000.
Substituting these values into the formula gives:
Expenditure on Transport=(15360)×15000
Step 4: Simplify the fraction
Now, simplify the fraction:
15360=124
Step 5: Calculate the expenditure
Now, we can calculate the expenditure on transport:
Expenditure on Transport=124×15000
Calculating this gives:
Expenditure on Transport=625
Final Answer
The monthly expenditure on transport is Rs. 625.
---
The total angle in a pie chart is 360 degrees. The angle representing transport expenses is given as 15 degrees.
We can set up a proportion to find the expenditure on transport. The formula to calculate the expenditure based on the angle is:
Here, the sector angle for transport expenses is 15 degrees, the total angle is 360 degrees, and the total monthly salary (or expenditure) is Rs. 15,000.
Now, simplify the fraction:
Now, we can calculate the expenditure on transport:
The monthly expenditure on transport is Rs. 625.
Topper's Solved these Questions
- DATA HANDLING BOOK - S CHAND IIT JEE FOUNDATIONCHAPTER - DATA HANDLING EXERCISE - Self Assessment Sheet - 27
10 Videos
- COMPOUND INTEREST BOOK - S CHAND IIT JEE FOUNDATIONCHAPTER - COMPOUND INTEREST EXERCISE - Self Assessment Sheet - 19
10 Videos
- DISTANCE, TIME AND SPEED BOOK - S CHAND IIT JEE FOUNDATIONCHAPTER - DISTANCE, TIME AND SPEED EXERCISE - Unit Test-3
20 Videos
Similar Questions
The following table shows the expenditure of a family whose monthly income is * 22,000.Represent the above data by a pie chart.
View SolutionMonthly salary of a person is Rs. 15000. Then the amount he spends on food and house rent given the central angle of the sector representing this is 60∘.
View Solution
Knowledge Check
If the monthly expenditure pattern of a person who earns a monthyl salary of Rs 15000 is represented in a pie diagram, then the sector angle of an item on transport expenses meassures 15∘. What is his monthely expenditure on transport?
ARs 450BRs 625CRs 675Dcannot be computed from the given dataThe given pie-chart shows the breakup (in percentage) of monthly expenditure of a person.

The central angle made by the sector of expenditure on fuel is how much more (in degrees) than the central angle made by the sector of clothes, if the ratio of the expenditure on fuel and clothes is 4:3 repsectively?A18B32C36D45A man's monthly salary is Rs.24000 and his monthly expenses on travel are Rs.2500. The central angle of the sector representing travel expenses in the pie chart would be
A30∘B37.5∘C45∘D60∘
A man's monthly salary is Rs. 2400 and his monthly expenses on travel are Rs. 250. The central angle of the sector representing travel expenses in the pie chart would be
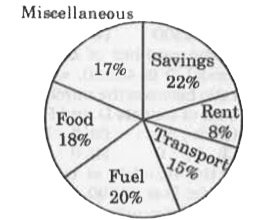
View SolutionThe pie chart given below shows the expenditure (in percentage) of Mahesh. The monthly income of Mahesh is Rs. 26000.

What will be the approximate difference (in Rs.) between the average expenditure on Savings, Rent and Fuel and average expenditure on Food. Transport and Savings?
View SolutionA saves 20% of his monthly salary. If his monthly expenditure is X 6000, then his monthly savings is
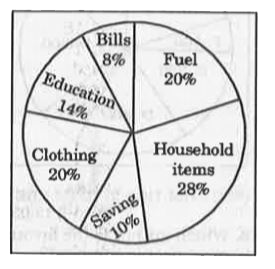
View SolutionThe given pie chart shows the monthly expenditure on various items and monthly savings of a household. The same distribution is followed for all the months of the year.

If the difference in monthly expenditure on clothing and education is Rs. 9000, then what is the different (in Rs.) in yearly saving and yearly expenditure on bills?
View SolutionThe given pie chart shows the monthly expenditure on various items and monthly savings of a household. The same distribution is followed for all the months of the year.

If the difference in monthly expenditure on clothing and education is Rs. 9000, then what is the different (in Rs.) in yearly saving and yearly expenditure on bills?
View Solution
