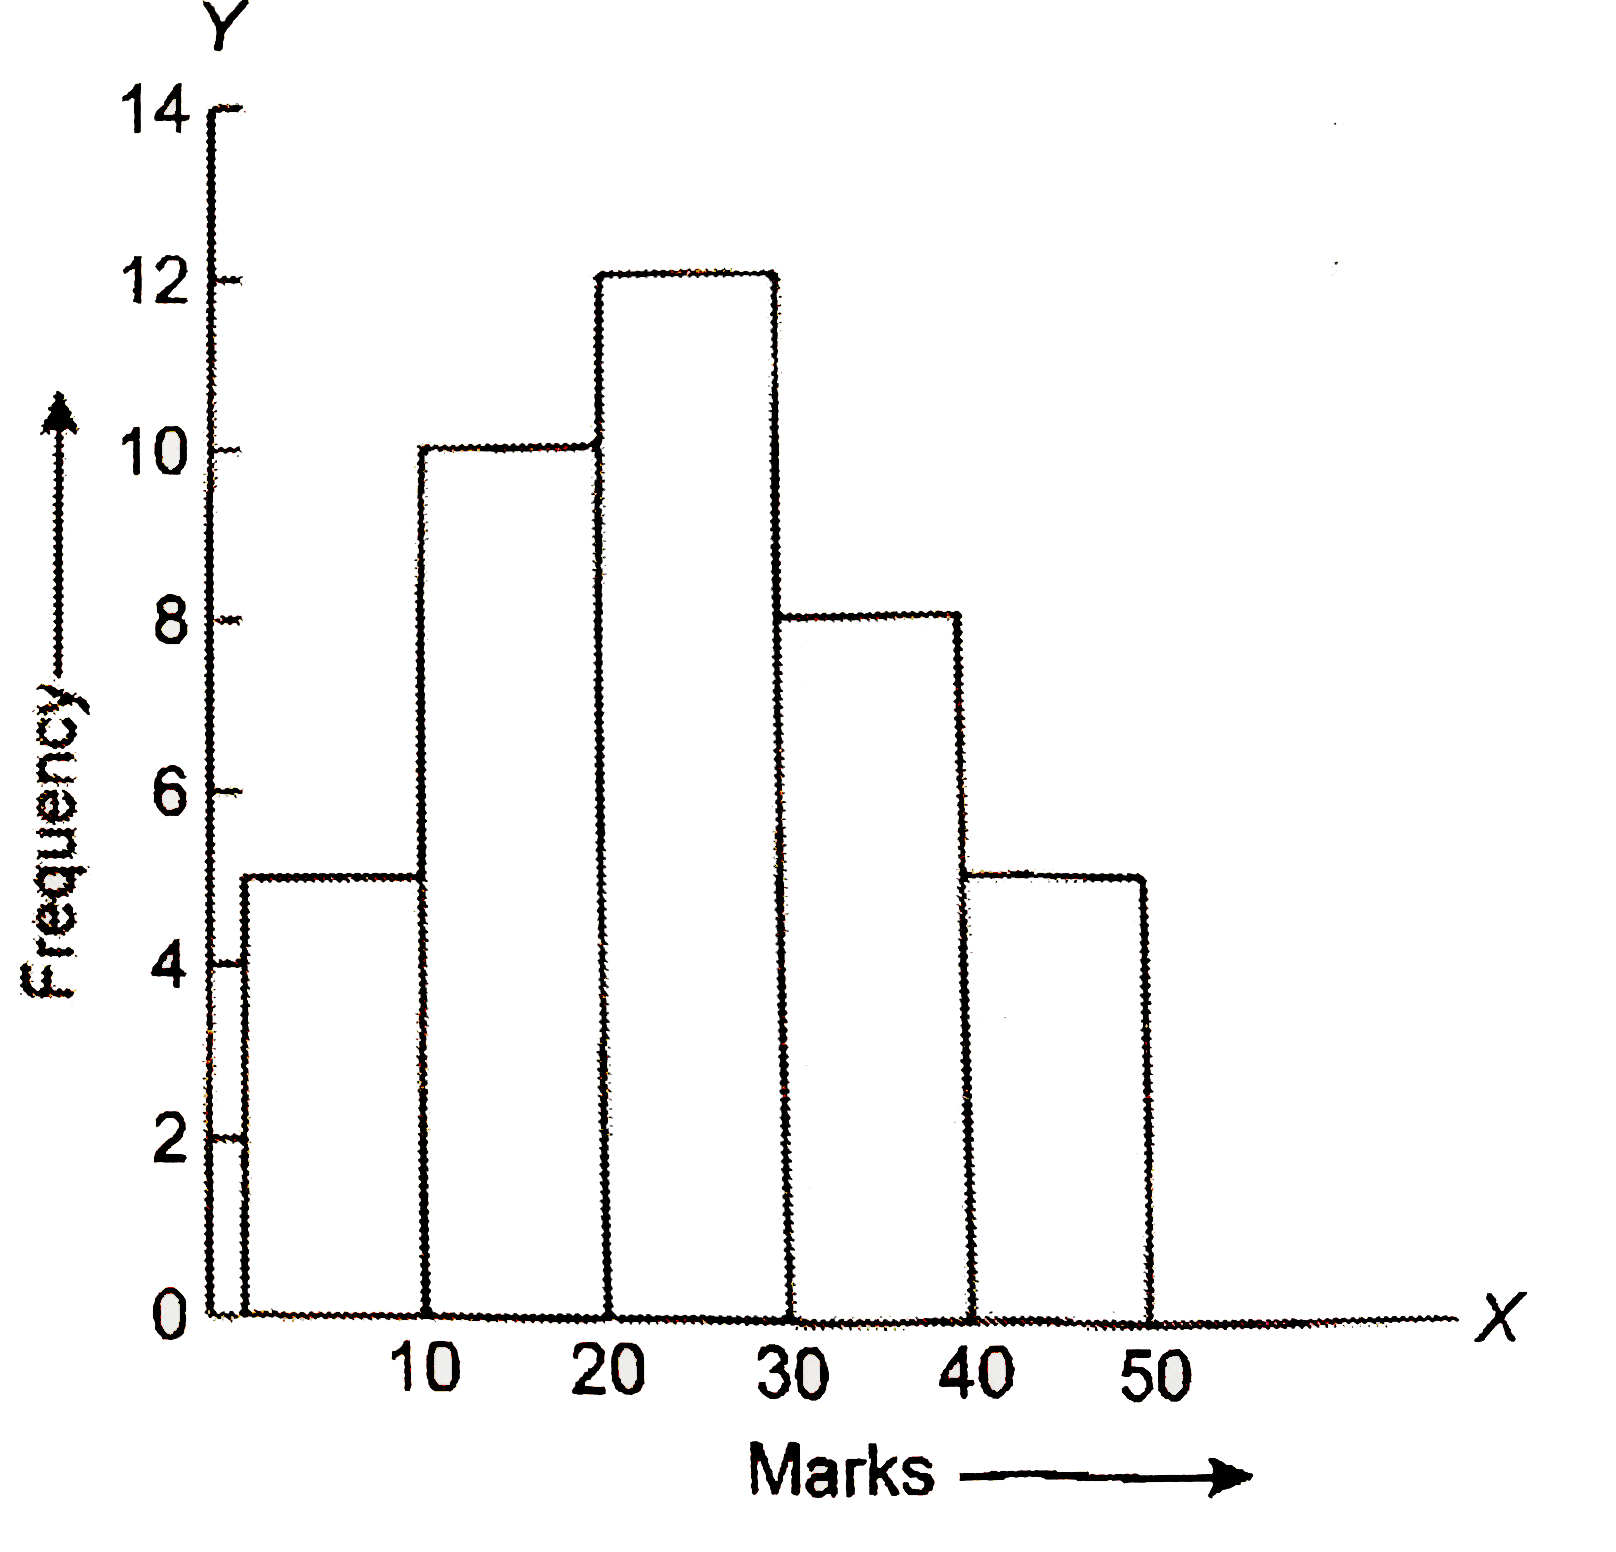
In a class of 40 students, the marks obtained (out of 50) are as given below:

Draw a histogram to represent the given data.
1. Taking suitable scales, mark the class intervals (marks) on the X-axis and frequency (the no. of students) on Y-axis.
2. Construct rectangles with class intervals as bases and the corresponding frequencies as heights.

Topper's Solved these Questions
- STATISTICSBOOK - NAGEEN PRAKASHANCHAPTER - STATISTICSEXERCISE - Problems From NCERT/exemplar
22 Videos
- STATISTICSBOOK - NAGEEN PRAKASHANCHAPTER - STATISTICSEXERCISE - Exercise 14a
10 Videos
- QUADRILATERALSBOOK - NAGEEN PRAKASHANCHAPTER - QUADRILATERALSEXERCISE - Revision Exercise (long Answer Questions)
5 Videos
- SURFACE AREA AND VOLUMEBOOK - NAGEEN PRAKASHANCHAPTER - SURFACE AREA AND VOLUMEEXERCISE - Revision Exercise (long Answer Questions)
10 Videos
Similar Questions
Draw a histogram to represent the following data.

View SolutionDraw the histogram to represent the following data.

View SolutionDraw a pictograph to represent the data given below :

View SolutionThe marks obtained (out of 100) by a class of 80 students are given below:

Construct a histogram to represent the data above
View SolutionThe marks obtained (out of 100) by a class of 80 students are given below:

Construct a histogram to represent the data above
View SolutionThe ages (in years) of 360 patients treated in a hospital on a particular day are given below:

Draw a histogram for the given data.
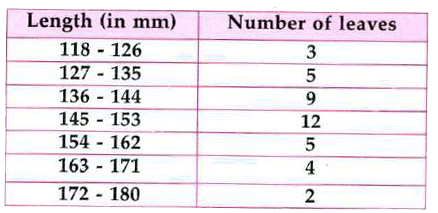
View SolutionThe length of 40 leaves of a plant are measured correct to nearest millimetres. The data obtained is as follows :

Draw histogram to represent the given data.
View SolutionThe length of 40 leaves of a plant are measured correct to one millimetre, and the obtained data is represented in the following table:

Draw a histogram to represent the given data. [Hint: First make the class intervals continuous]
View SolutionThe marks scored by students in Mathematics in a certain examinations are given below:

Draw histogram for the above data.
View SolutionThe marks scored by students in Mathematics in a certain examinations are given below:

Draw histogram for the above data.
View Solution
