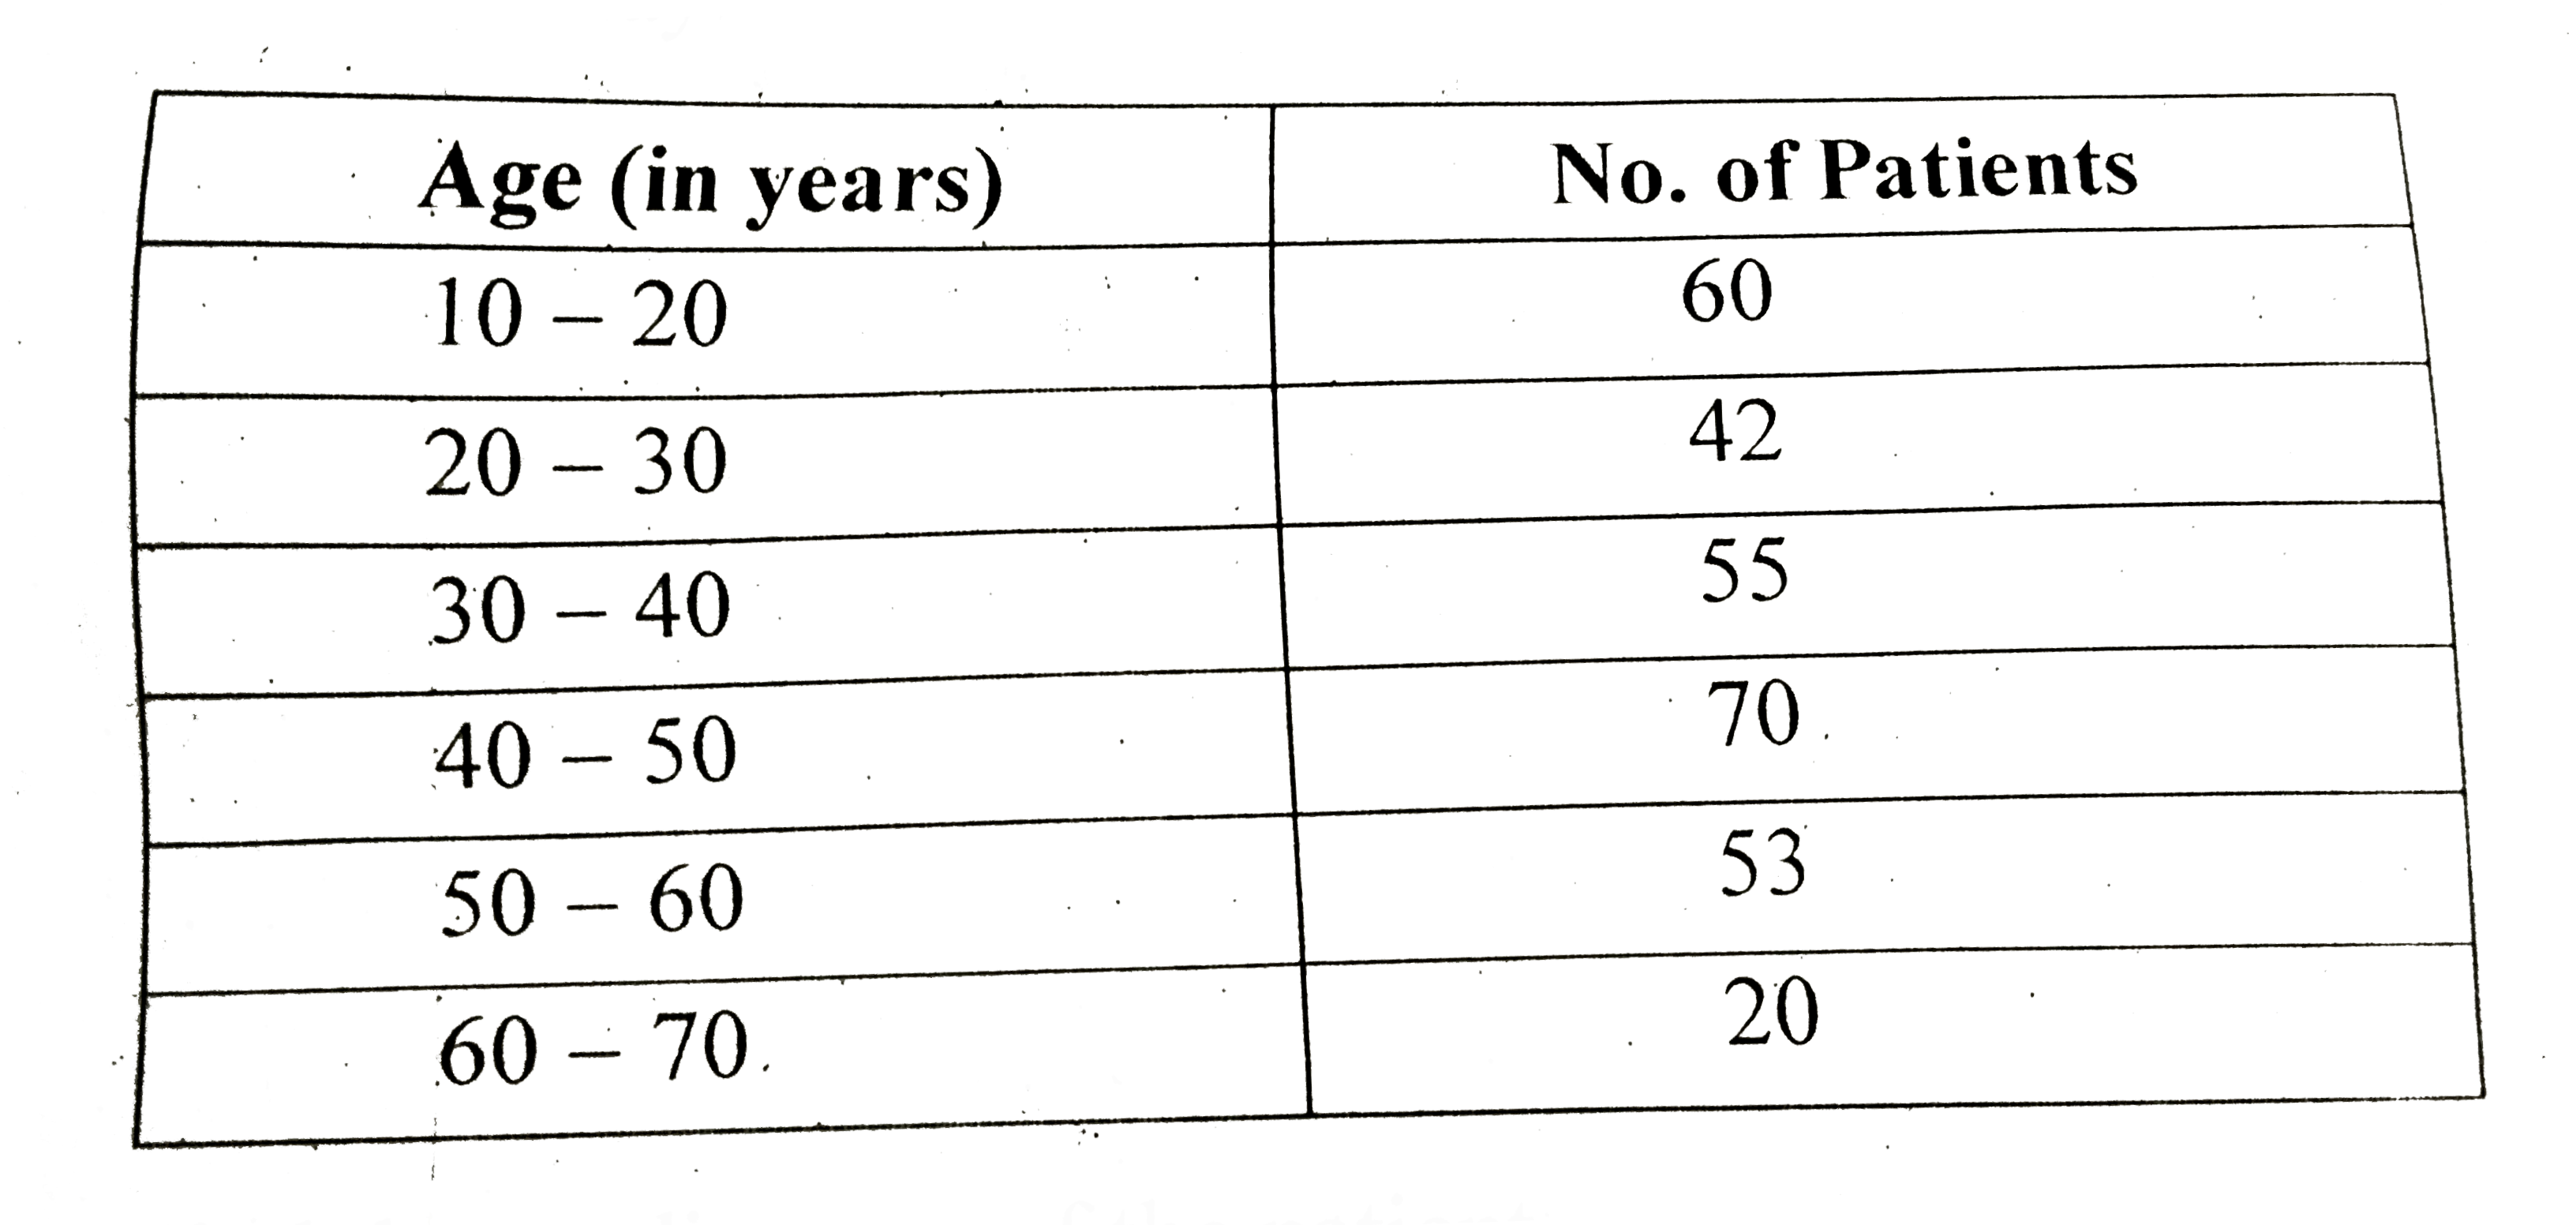
The ages (in years) of 360 patients treated in a hospital on a particular day are given below:

Draw a histogram for the given data.
Step by step video & image solution for The ages (in years) of 360 patients treated in a hospital on a particular day are given below: Draw a histogram for the given data. by Maths experts to help you in doubts & scoring excellent marks in Class 8 exams.
Topper's Solved these Questions
- BOOK - RS AGGARWALCHAPTER - DATA HANDLING EXERCISE - Exercise 21B6videos
DATA HANDLING
- BOOK - RS AGGARWALCHAPTER - CUBES AND CUBE ROOTSEXERCISE - Test Paper-4 (Fill in the blanks)4videos
CUBES AND CUBE ROOTS
- BOOK - RS AGGARWALCHAPTER - DIRECT AND INVERSE PROPORTIONSEXERCISE - TEST PAPER -12 (Fill in the blanks )5videos
DIRECT AND INVERSE PROPORTIONS
Similar Questions
In a class of 40 students, the marks obtained (out of 50) are as given below:

Draw a histogram to represent the given data.View SolutionThe marks scored by students in Mathematics in a certain examinations are given below:

Draw histogram for the above data.View SolutionThe marks scored by students in Mathematics in a certain examinations are given below:

Draw histogram for the above data.View SolutionThe following table shows ages of 300 patients getting medical treatment in a hospital on a particular day:

Find the median age of the patient.View SolutionThe top speeds of 30 different land animals have been organised into a frequency table given below:

Draw a histogram for the given data.View SolutionMake a frequency polygon and histogram using the given data :
 View Solution
Following are the ages (in years) of 360 patients , getting medical treatment in a hospital :

One of the patients is selected at random
What is the probability that his age is
(i) 30 years or more but less than 40 years ?
(ii) 50 years or more but less than 70 years ?
(iii) 10 years or more but less than 40 years ?
(iv) 10 years or more ?
(v) less than 10 years ?View SolutionThe following frequency dsitribution table gives the ages of 80 patients treated in a hospital during a month. Find the mode of the ages of the patients.
 View Solution
The following frequency distribution table gives the ages of 200 patients treated in a hospital in a weak. Find the mode of ages of the patients.
 View Solution
The following frequency distribution table gives the ages of 200 patients treated in a hospital in a week. Find the mode of ages of the patients.
 View Solution

