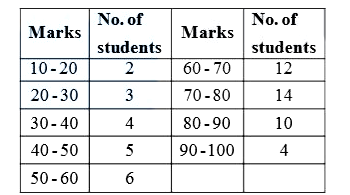
The marks scored by students in Mathematics in a certain examinations are given below:

Draw histogram for the above data.
Step by step video & image solution for The marks scored by students in Mathematics in a certain examinations are given below: Draw histogram for the above data. by Maths experts to help you in doubts & scoring excellent marks in Class 10 exams.
Updated on:21/07/2023Topper's Solved these Questions
- ALGEBRA MARCH 2016BOOK - GURUKUL PUBLICATION - MAHARASHTRA PREVIOUS YEAR PAPERSCHAPTER - ALGEBRA MARCH 2016EXERCISE - Attempt any two of the following subquestions:
3 Videos
- ALGEBRA MARCH 2016BOOK - GURUKUL PUBLICATION - MAHARASHTRA PREVIOUS YEAR PAPERSCHAPTER - ALGEBRA MARCH 2016EXERCISE - Attempt any two of the following subquestions :
3 Videos
- ALGEBRA MARCH 2016BOOK - GURUKUL PUBLICATION - MAHARASHTRA PREVIOUS YEAR PAPERSCHAPTER - ALGEBRA MARCH 2016EXERCISE - Attempt any four of the following subquestions:
6 Videos
- ALGEBRA MARCH 2015BOOK - GURUKUL PUBLICATION - MAHARASHTRA PREVIOUS YEAR PAPERSCHAPTER - ALGEBRA MARCH 2015EXERCISE - Attempt any two of the following sub-questions:
6 Videos
- ALGEBRA MARCH 2018BOOK - GURUKUL PUBLICATION - MAHARASHTRA PREVIOUS YEAR PAPERSCHAPTER - ALGEBRA MARCH 2018EXERCISE - Attempt any two of the following subquestions:
6 Videos
Similar Questions
Knowledge Check
The marks obtained by 60 students in a certain test are given below :

Median of the above data isA68.33B70C68.11DNone of these
Draw a histogram of the following data.

View SolutionDraw a histogram of the following data

View SolutionDraw a histogram from the following data:

View SolutionDraw a histogram of the following data :

View SolutionThe marks obtained by 200 students in an examination are given below. : Draw a less than ogive for the above distribution and use less than ogive to find median.
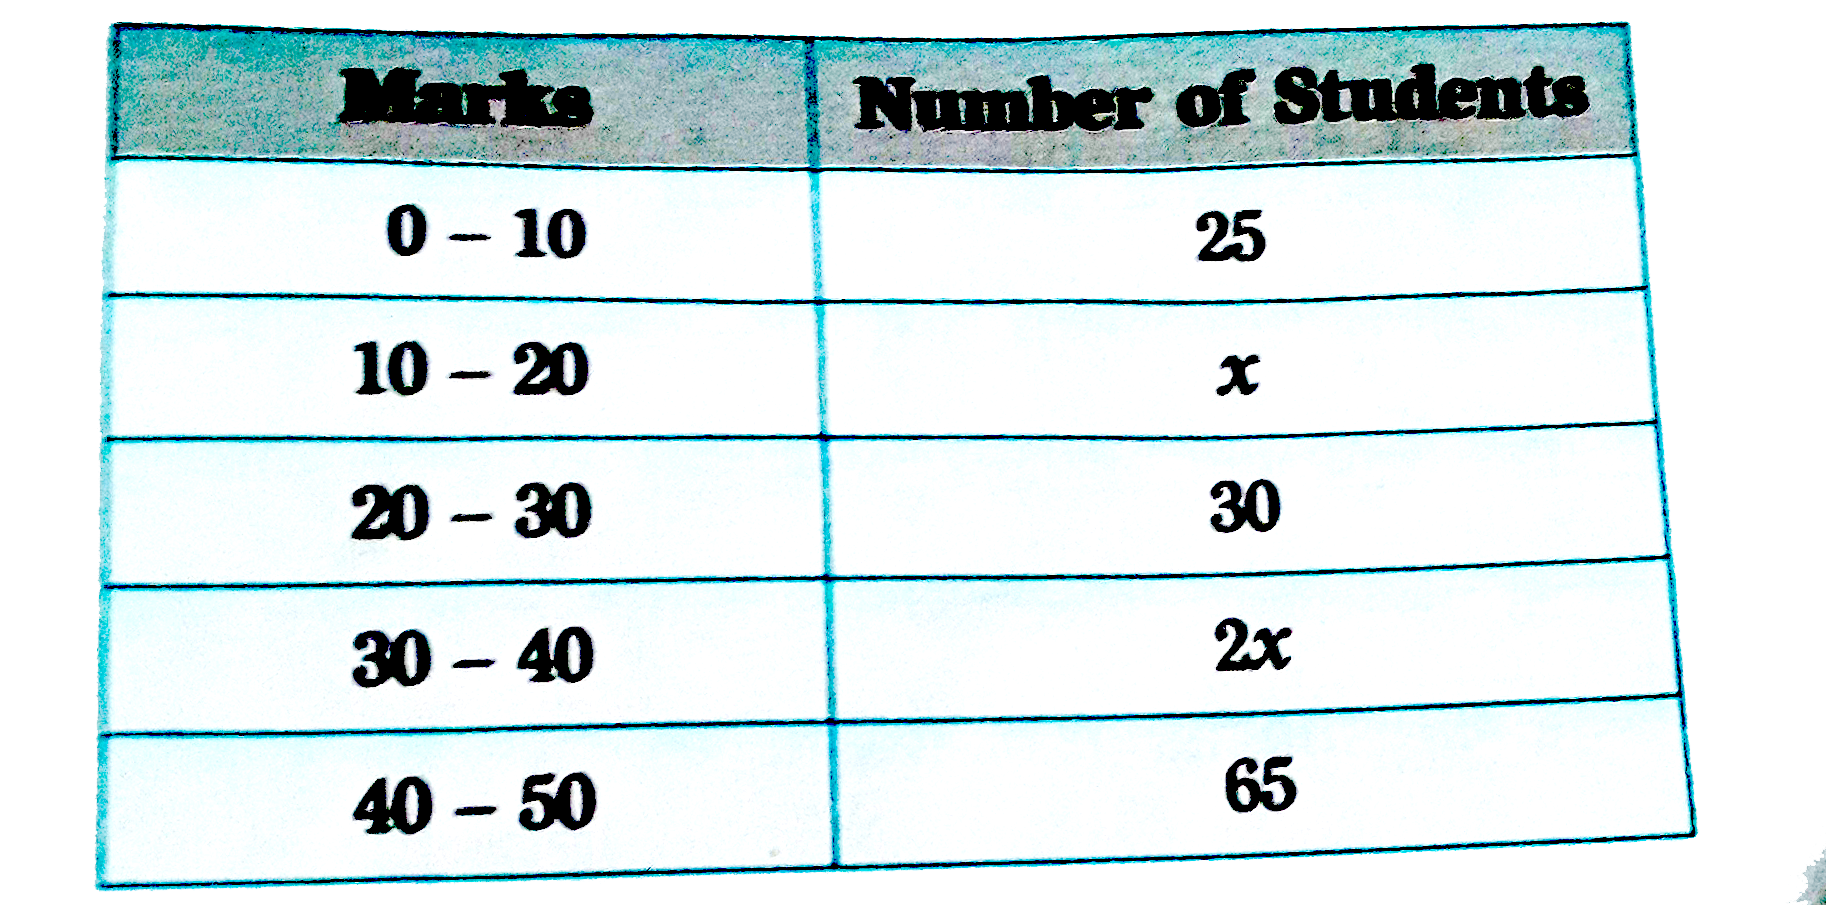
View SolutionThe following frequency distribution table shows marks obtained by 180 students in Mathematics examination :

Find the value of x.
Also draw a histogram representing the above informations.
View SolutionThe following table shows the marks secored by a student in annual examination in various subjects. Draw a histogram to represent the given data.
SubjectTeluguHindiEnglishMathsScienceSocial StudiesMarks807482949088
View Solution


