In a study of numer of road accidents in a city, the observations for the 30 days of April 2003,were
4,3,5,6,4,3,2,5,4,2,6,2,1,2,2,0,5,4,6,1,3,0,5,3,6,1,5,5,2 and 6.
Prepare a frequency distribution table for the above data.Solution in Punjabi
Step by step video & image solution for In a study of numer of road accidents in a city, the observations for the 30 days of April 2003,were 4,3,5,6,4,3,2,5,4,2,6,2,1,2,2,0,5,4,6,1,3,0,5,3,6,1,5,5,2 and 6. Prepare a frequency distribution table for the above data. by Maths experts to help you in doubts & scoring excellent marks in Class 8 exams.
Updated on:21/07/2023Topper's Solved these Questions
Similar Questions
Draw an appropriate graph to represent the given information.

View SolutionWhich of the following numbers are not perfect cubes?
392.
View SolutionThe cost of 5 metres of a particular quality of cloth is Rs 210. Tabulate the cost of 2, 4, 10 and 13 metres of cloth of the same type.
View SolutionIn a study of number of accidents per day, the observations for 30 days were obtained as follows: 6, 3, 5, 6, 4, 3, 2, 5, 4, 2 4, 2, 1, 2, 2, 0, 5, 4, 6, 1 6, 0, 5, 3, 6, 1, 5, 5, 2, 6 Prepare a frequency distribution table
View SolutionIn a study of number of accidents per day, the observations for 30 days were obtained as follows: 6,3,5,6,4,3,2,5,4,2,4,2,1,2,2 0,5,4,6,1,6,0,5,3,6,1,5,5,2,6 Prepare a frequency distribution table.
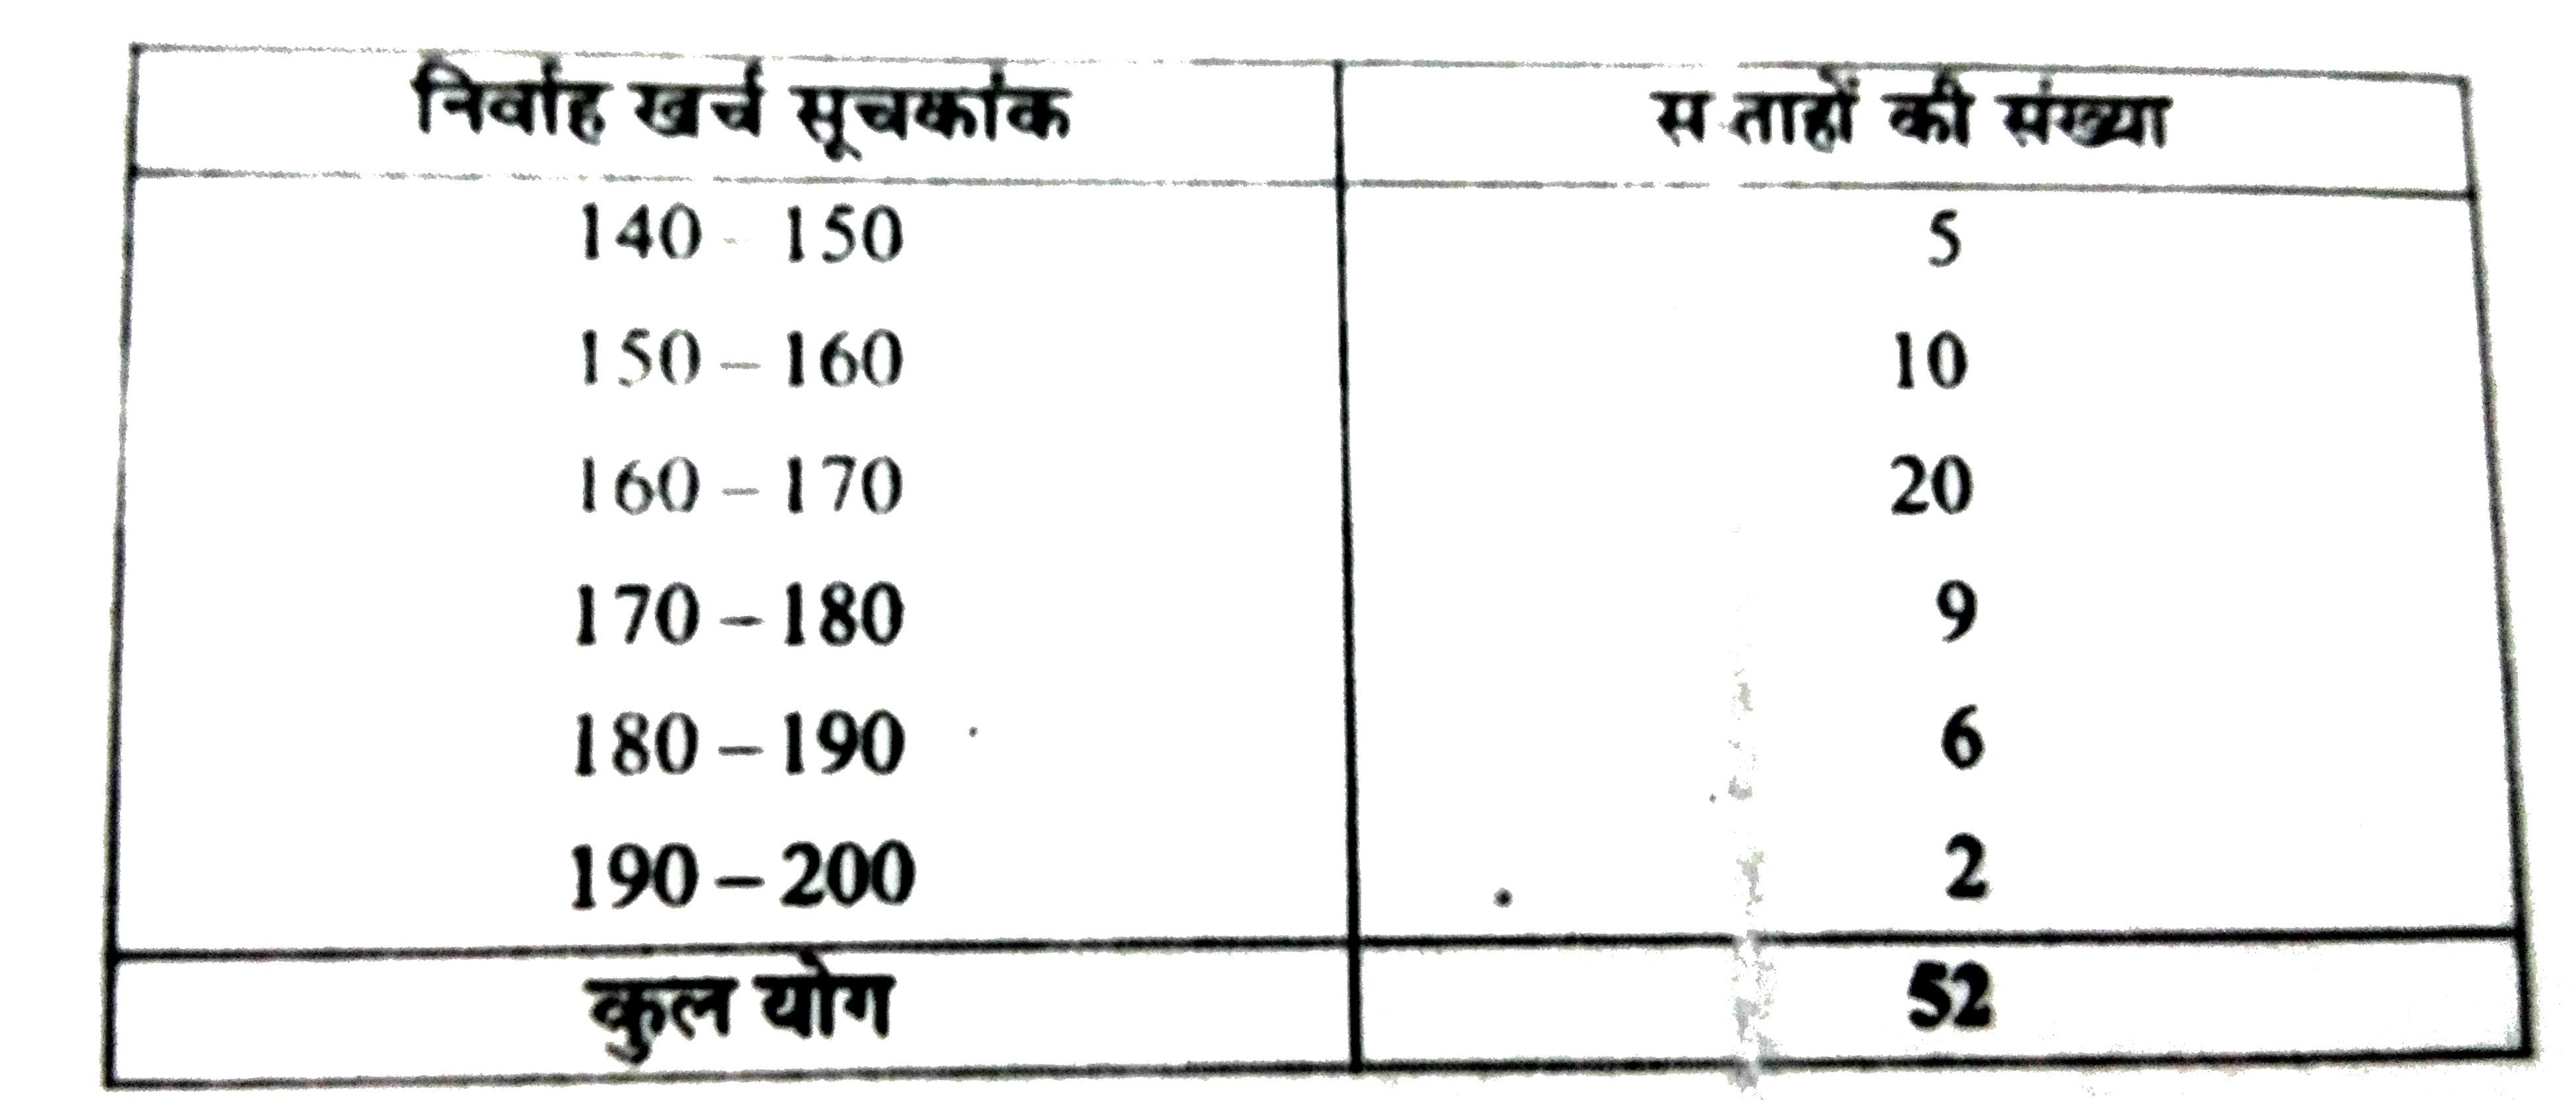
View Solutionएक नगर में निर्वाह खर्च सूचकांक (cost of living index) का अध्ययन करने के लिए निम्नलिखित साप्ताहिक प्रेक्षण किए गए :

ऊपर दिए गए आँकड़ों का एक बारम्बारता बहुभुज (आयतचित्र बनाए बिना ) खींचिए ।
View Solutionप्रतिदिन होने वाली दुर्घटनाओं की संख्या का अध्यन करने पर 30 दिनों के प्राप्त प्रेक्षण इस प्रकार हैं 4,3,5,6,4,3,2,5,4,2,6,2,1,2,2,0,5,4,6,1,3,0,5,3,6,1,5,5,2,6
बारम्बारता बंटन सारणी बनाये।
View Solutionतीन सिक्के 30 बार उछाले गये। प्रत्येक बार आये चित् की संख्या निम्न प्रकार लिखी गयी :
0,1,2,2,1,2,3,1,3,0,1,3,1,1,2,2,0,1,2,1,3,0,0,1,1,2,3,2,2,0
उपरोक्त आँकड़ों के लिए एक बारंबारता बंटन सारणी तैयार कीजिए।
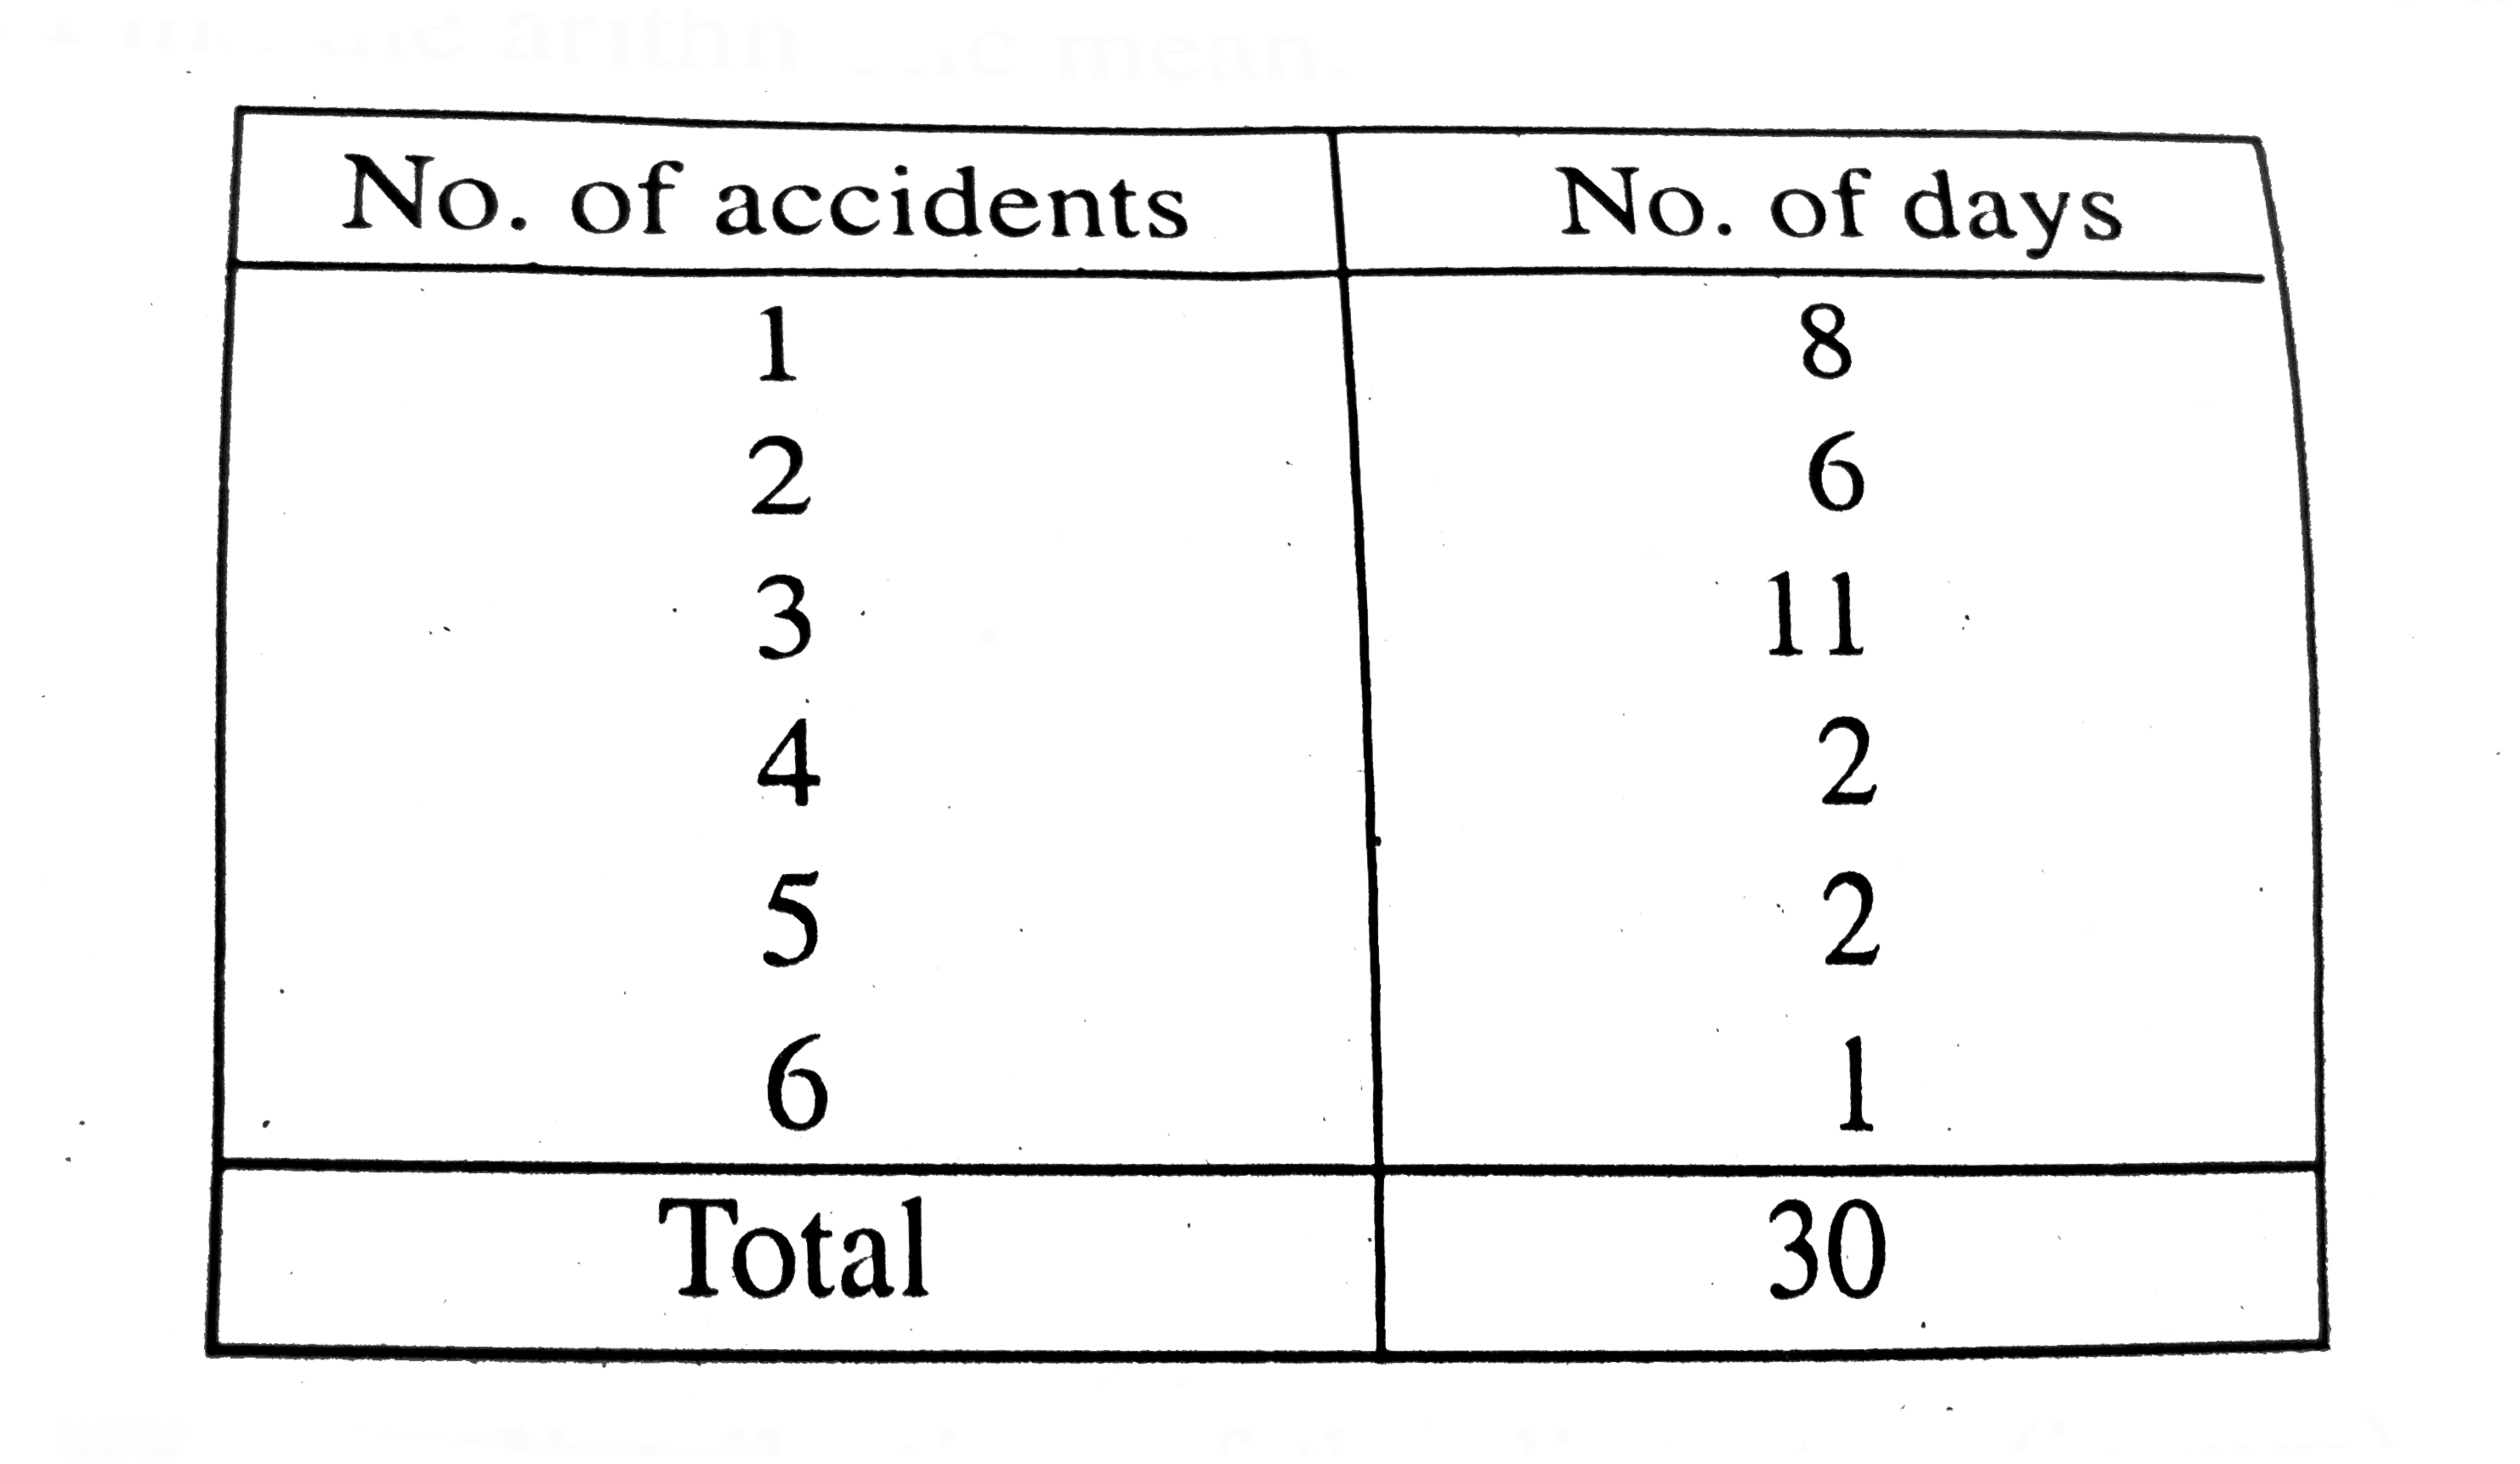
View SolutionThe frequency distribution of the number of accidents in 30 consecutive days in a city are given below. Find the arithmetic mean.

View SolutionA study was conducted to find out the concentration of sulphur dioxide in the air in parts per million (ppm) of a certain city. The data obtained for 30 days is as follows :

You were asked to prepare a frequency distribution table, regarding the concentration of sulphur dioxide in the air in parts per million (ppm) of a certain city for 30 days . Using this table, find the probability of the concentration of sulphur dioxide in the interval 0.12-0.16 on any of these days.
View SolutionIn a study of number of accidents per day, the observations for 30 days were obtained as follows: 6,3,5,6,4,3,2,5,4,2,4,2,1,2,2 0,5,4,6,1,6,0,5,3,6,1,5,5,2,6 Prepare a frequency distribution table.
View SolutionThree coins were tossed 30 times simultaneously. Each time the number of heads occurring was noted down as follows:

Prepare a frequency distribution table for the data given above.
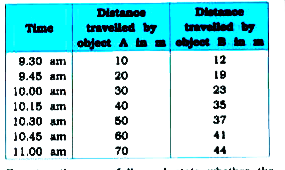
View SolutionThe data regarding the motion of two different objects A and B are given in the following table :

Examine them carefully and state whether the motion of the objects is uniform or non-uniform.
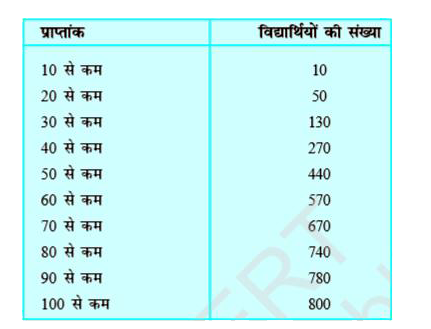
View Solutionनिम्नलिखित सारणी किसी परीक्षा में 800 विद्यार्थियों के प्राप्तांकों के संचयी बारंबारता बंटन को दर्शाती है:

उपरोक्त आंकड़ों के लिए एक बारंबारता बंटन सारणी की रचना कीजिए।
View SolutionThree coins were tossed 30 times simultaneously.Each time thenumber of heads occurring was noted down asfollows :
 Prepare a frequency distribution for the data given above
View Solution
