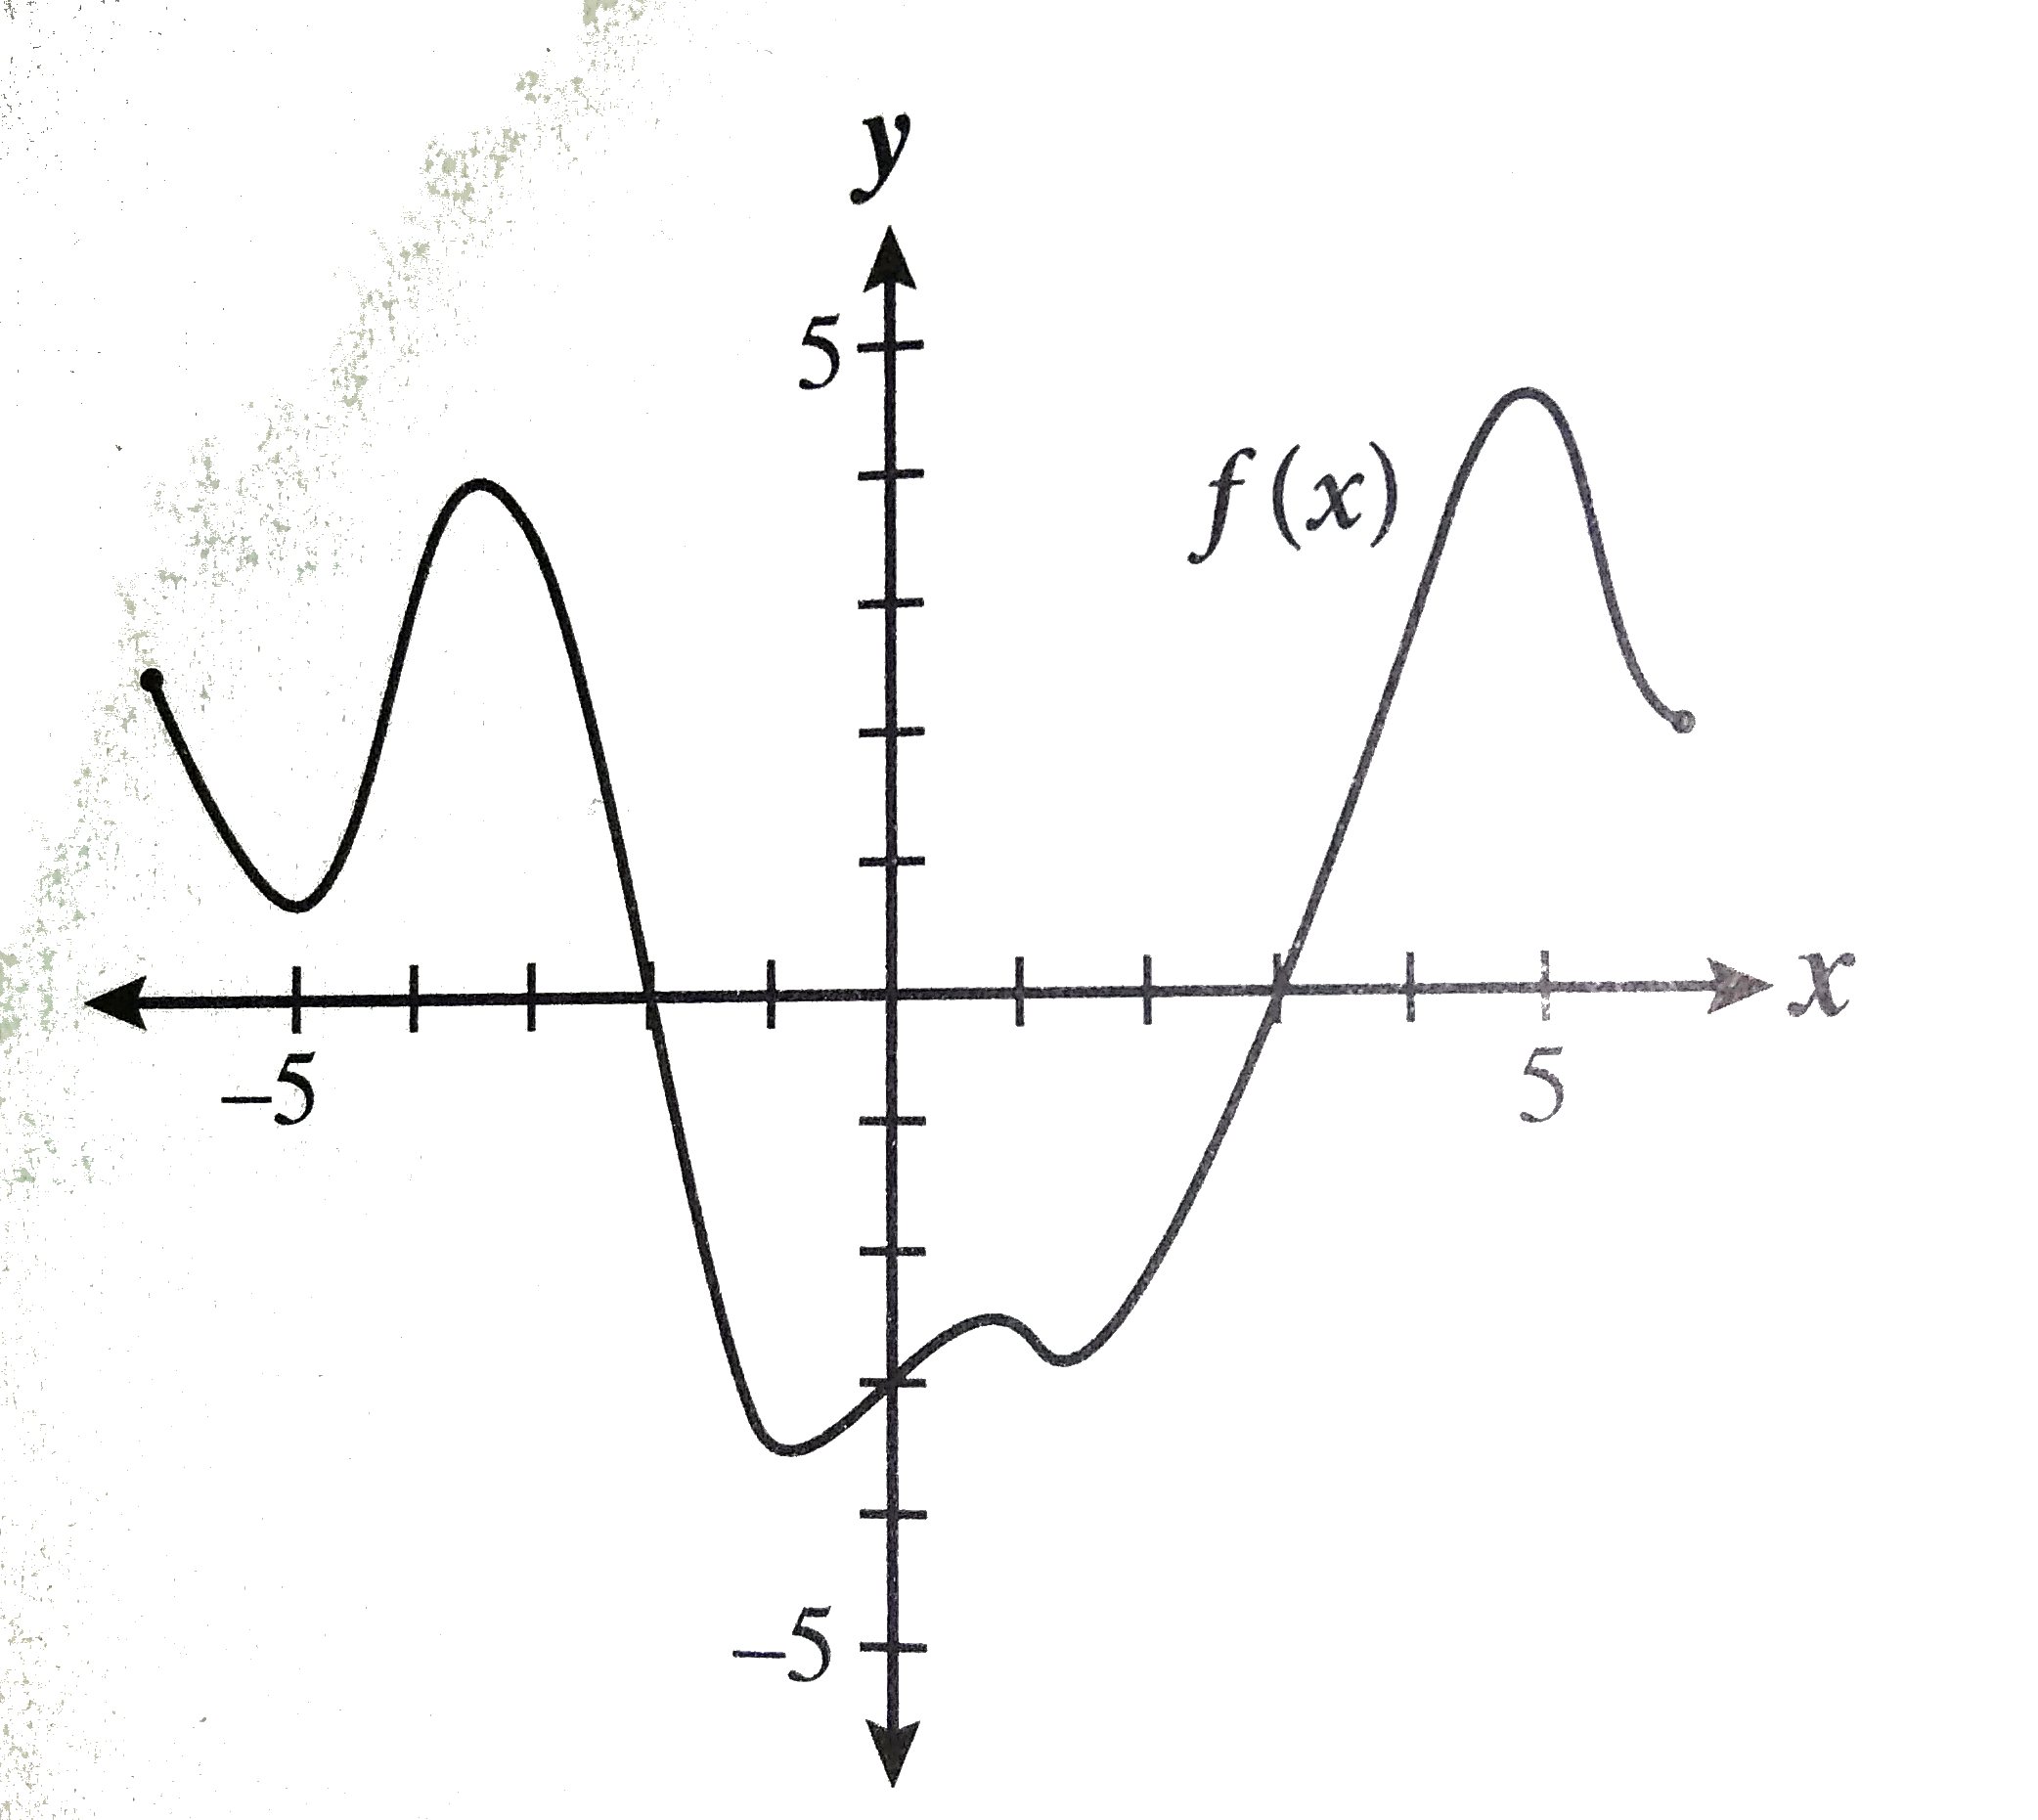
In Figure shows the graph of f(x), what is the value of f(f(3)) ?
A
−4
B
−2
C
0
D
1
Video Solution
Text Solution
The correct Answer is:C
Don't try to figure out an equation to fit this weired graph. Just read the values right off the graph. First, find f(3). Go to +3 on the x - axis and see what y is there. It's -2. Now find f(-2). Go to -2 on the x - axis and see what y is there. It's 0 :
f(3)=−2
f(f(3))=f(−2)=0
|
Topper's Solved these Questions
Similar Questions
Knowledge Check
If f(x)=x2+6, what is the value of f(3)?
A15B33C39D729
If f(x)=|x+1|−1, what is the minimum value of f(x) ?
View SolutionIf f(x)=2x2−5x+7, what is the value of f(8)−f(3) ?
View SolutionThe following figure shows the graph of f(x)=ax2+bx+c, find the signs of a,bandc.
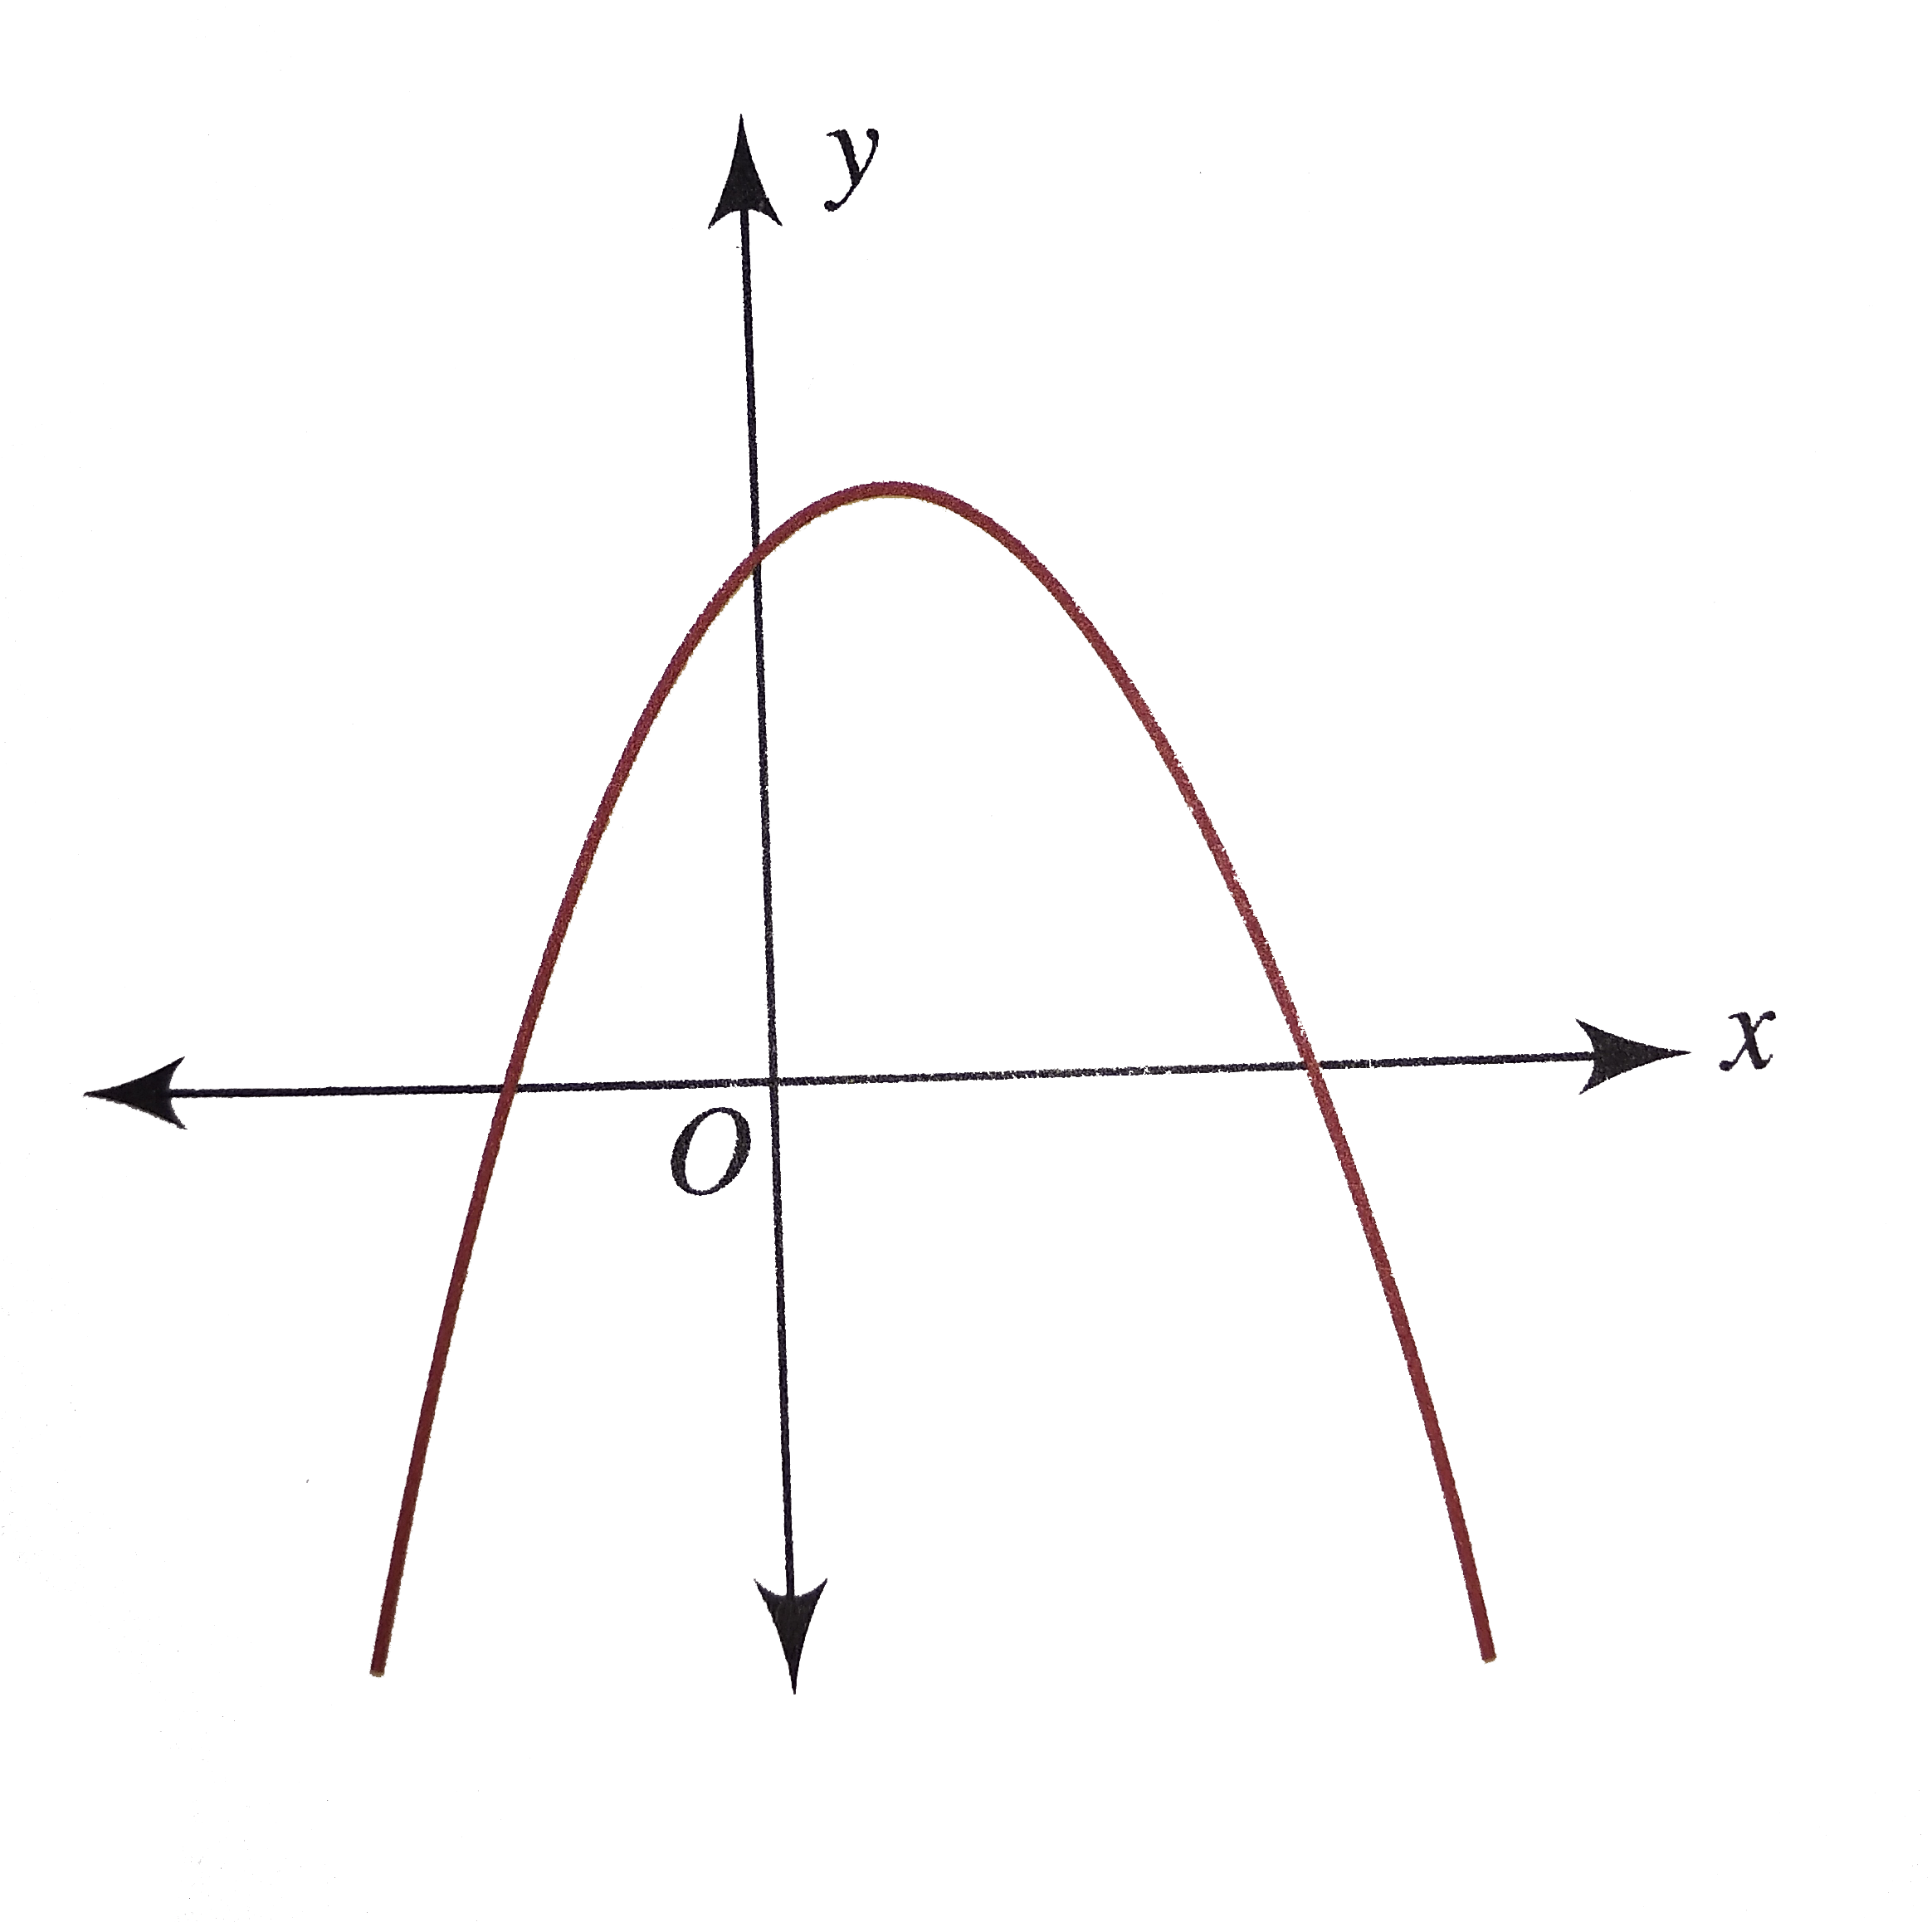
View SolutionThe following figure shows the graph of f(x)=ax2+bx+c, then find the sign of values of a,bandc.
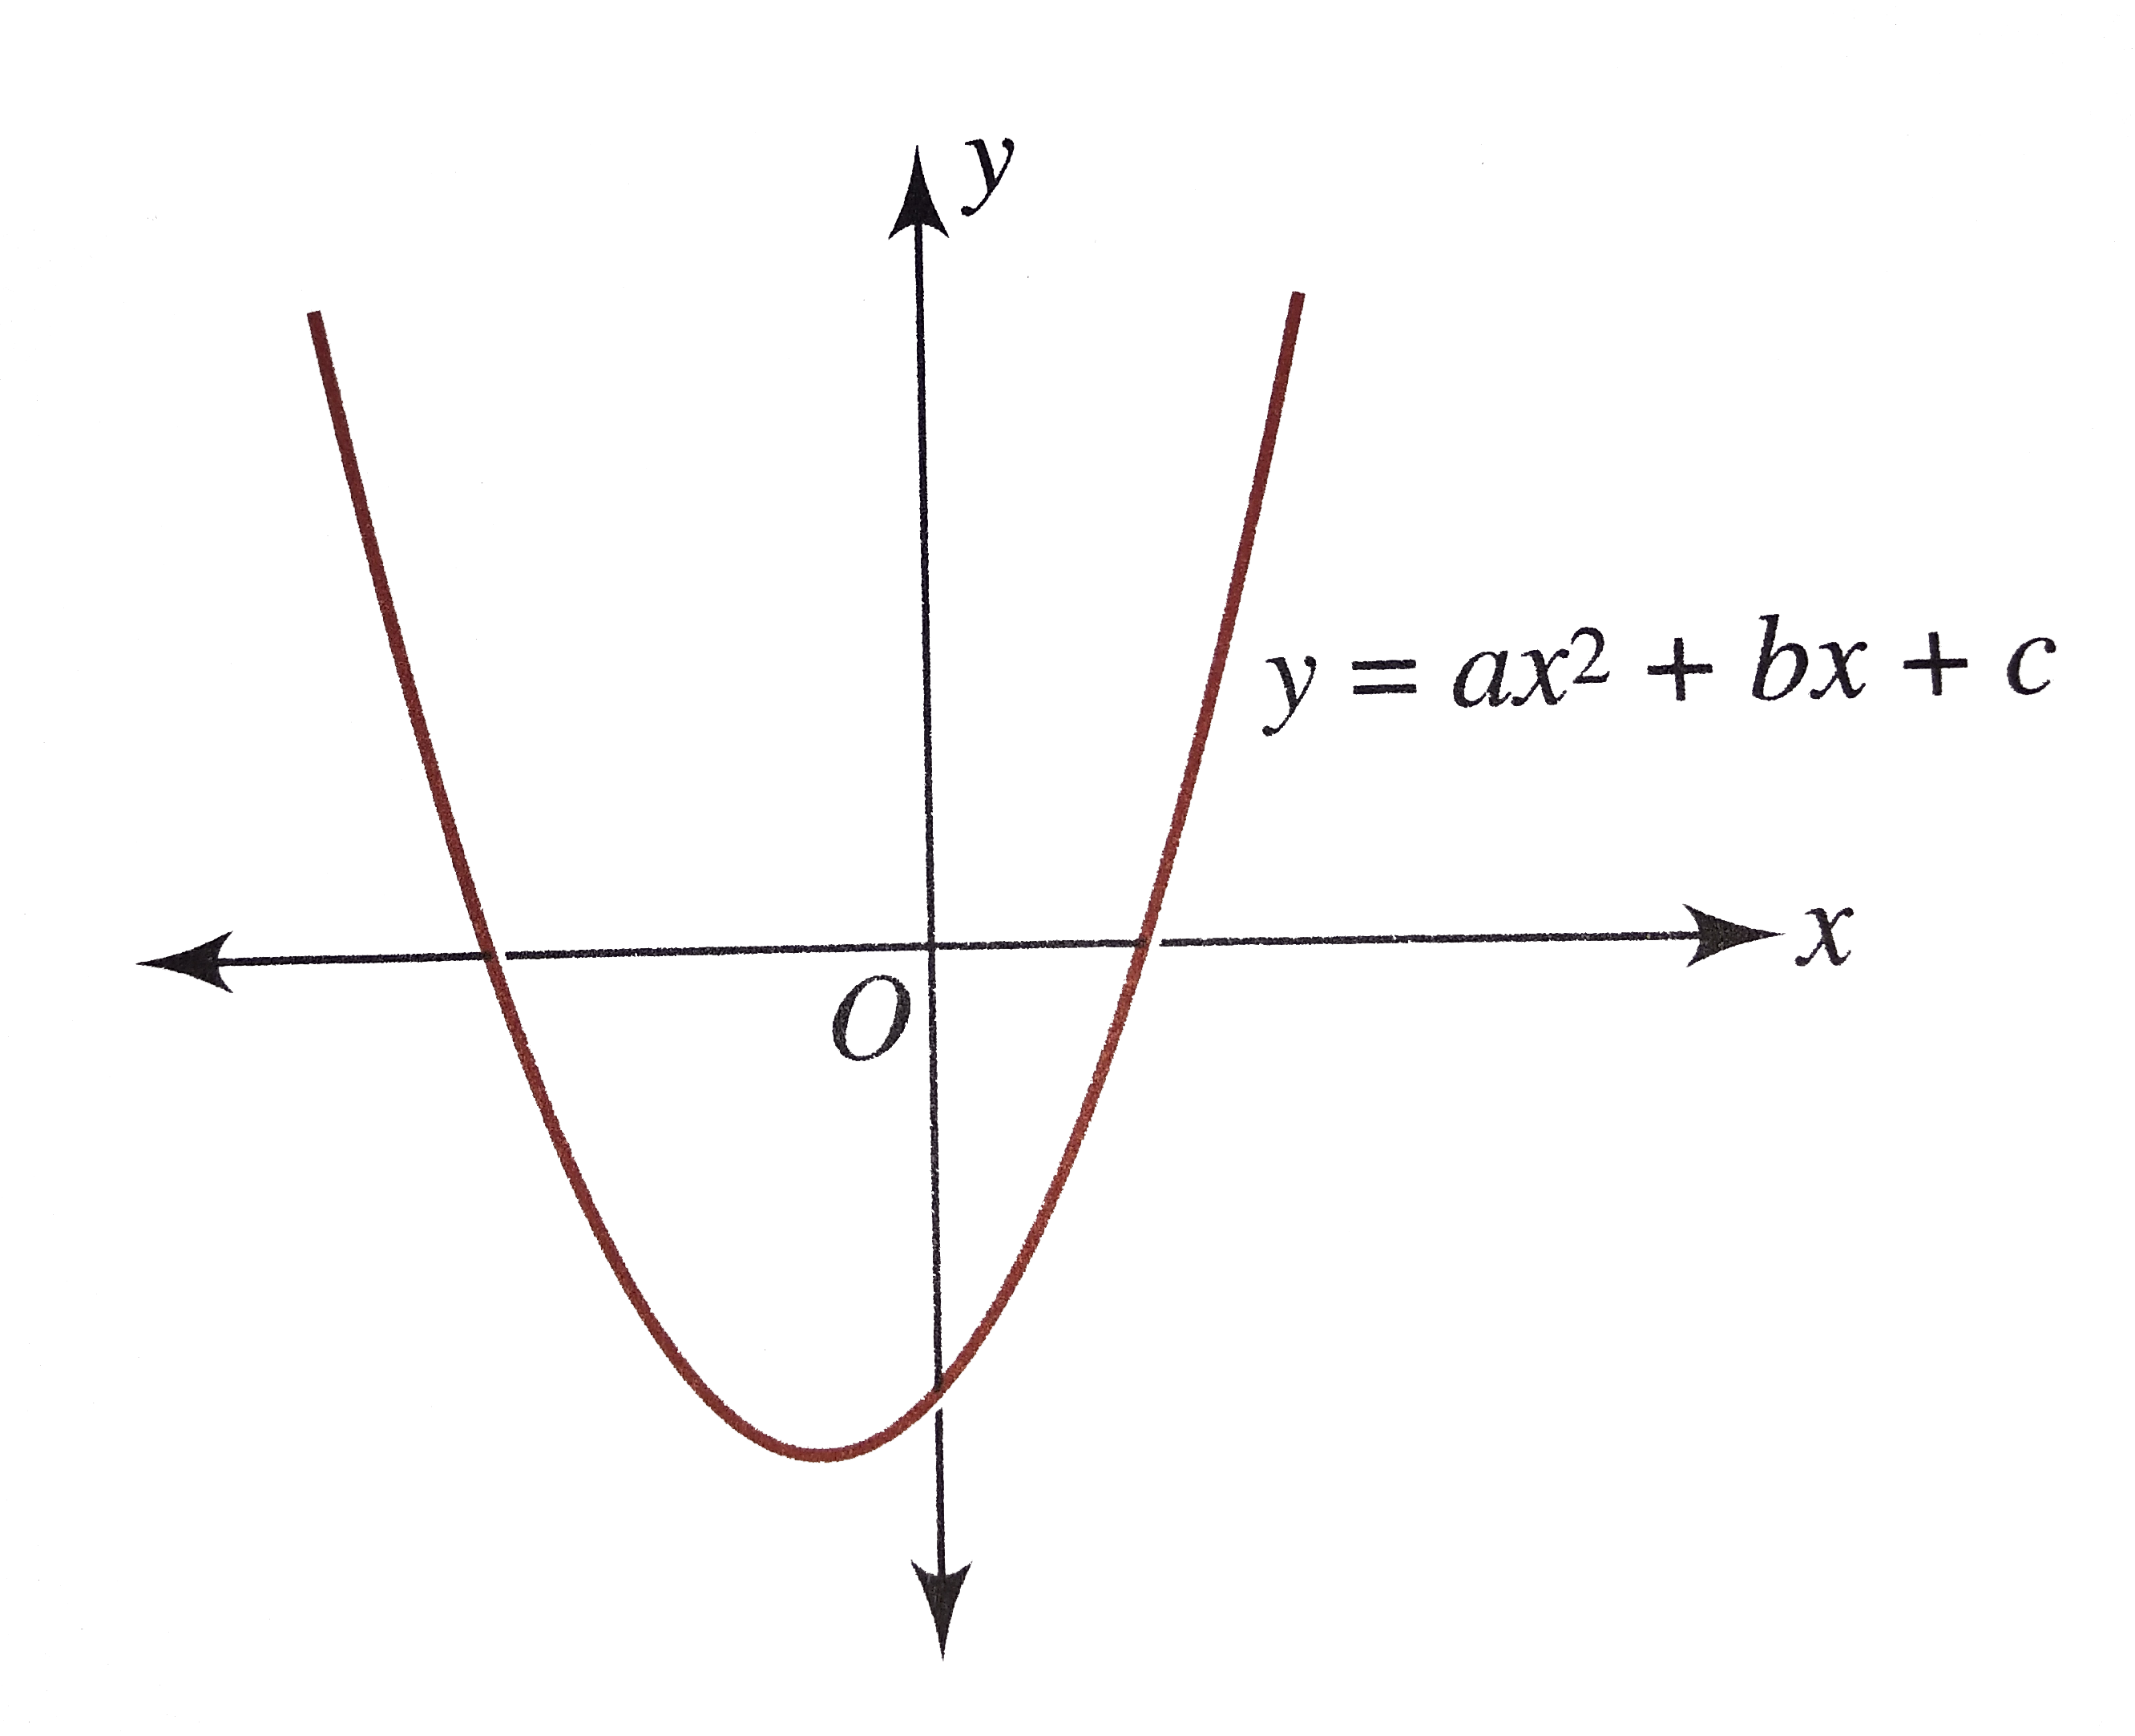
View SolutionThe above figure shows the graph of y=f(x) where c is a nonzero constant. If f(w+1.7)=0andw>o, what is a possible value of w?
View Solution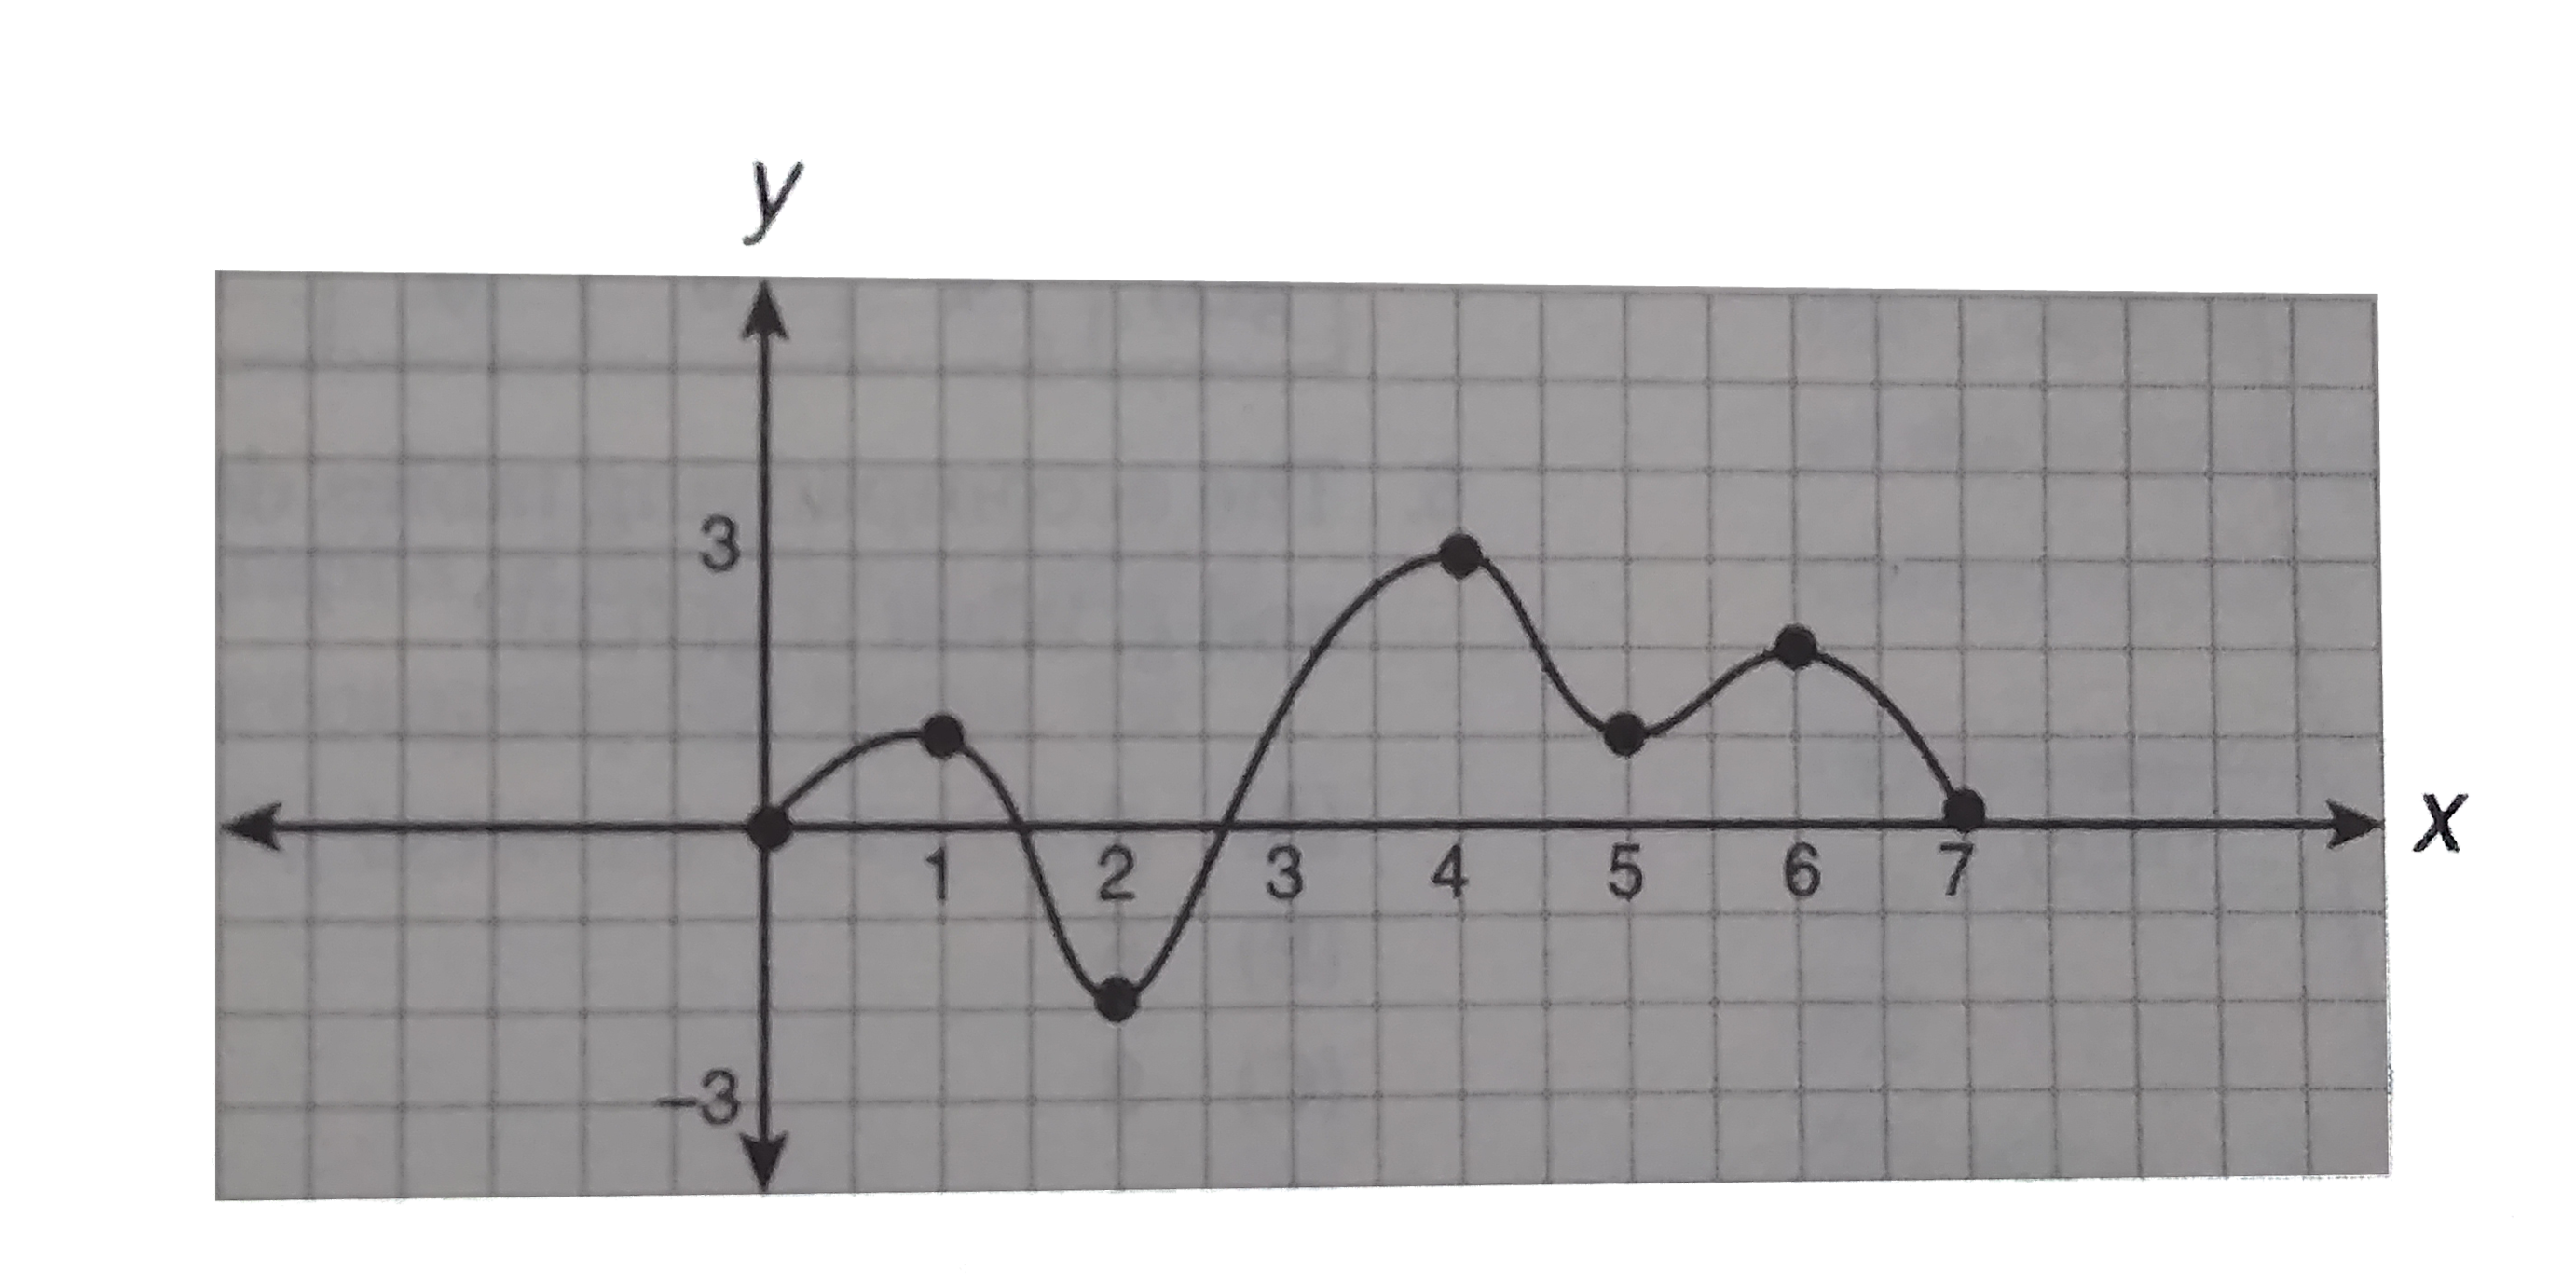
The graph above shows the function y=f(x) over the interval 0≤x≤7. What is the value of f(f(6))?
View SolutionLet the function f and g be defined by the graphs in the accompanying diagram. What is the value of f(g(3))?
View Solution

