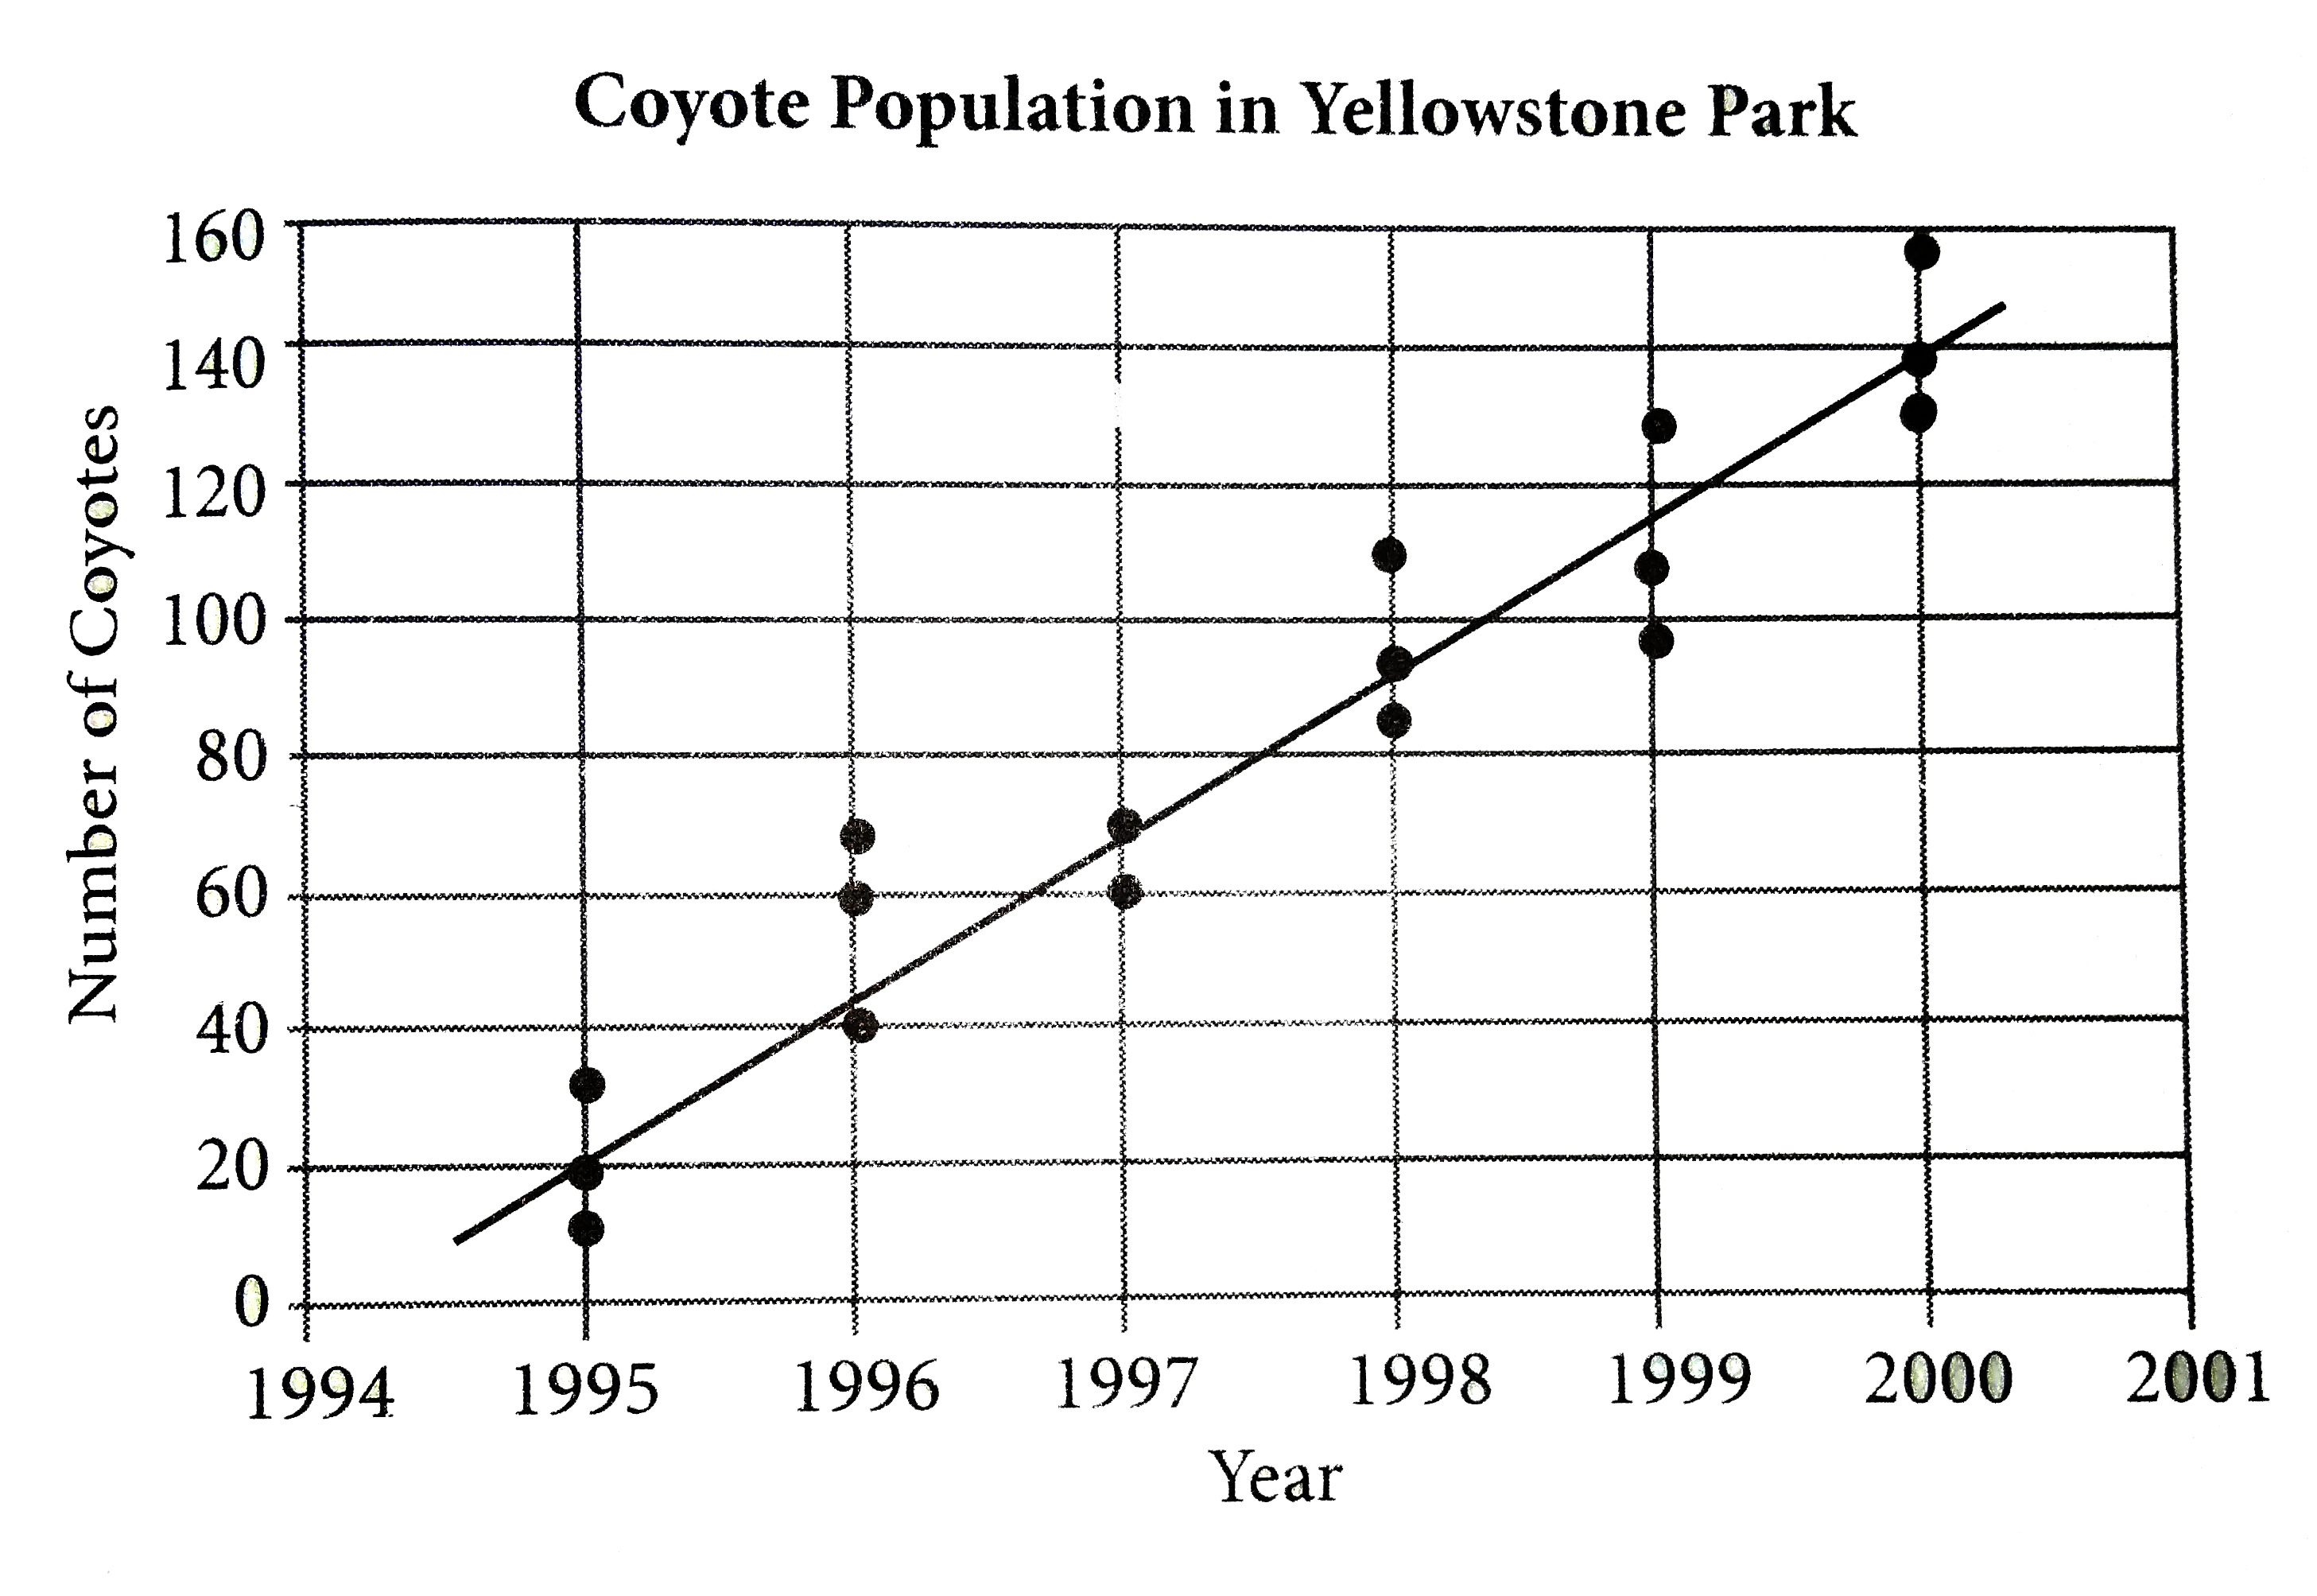
In the 1990s, the park rangers at Yellowstone National park implemented a program aimed at increasing the dwindling coyote population in Montana. Results of studies of the coyote population in the park are shown in the scatterplot below.

Based on the line of best fit in the scatterplot above, which of the following is the closest to the average annual increase in coyotes in Yellowstone Park between 1995 and 2000?
22
24
26
28
The correct Answer is:B
Topper's Solved these Questions
Similar Questions
The population ,P, of town Y since 1995 can be estimated by the equation P=1.0635x+3,250, where x is the number of years since 1995 and 0≤x≤20. In the context of this equation, what does the number 1.0635 most likely represent?
View SolutionIF the function g is defined by g(x)=3x+5, what is the value of g(-5)?
View SolutionIF 3y=y+2, what is the value of 2y?
View SolutionHow many lines of symmetry does the above figure have ?
View SolutionWhich of the following are correct chain isomers of butane ? (i)
View SolutionDetermine the point of symmetry of a regular hexagon.
View SolutionDtermine the images of the following figure about the given line :
View SolutionMatch the following Column A to Column B

View SolutionMatch the following Column A to Column B

View SolutionMatch the following Column A to Column B

View SolutionThe inequation represented by the graph given below is :
View SolutionThe inequation that best describes the graph given below is _________
View SolutionThe inequation that best describes the following graph is _________
View SolutionWhich inequations represent the shaded region in the given figure
View SolutionThe equation of straight line shown in figure is :
ltimg src="https://d10lpgp6xz60nq.cloudfront.net/physics_images/ALN_PHY_R04_E01_020_Q01.png" width="80%"gt
View Solution
