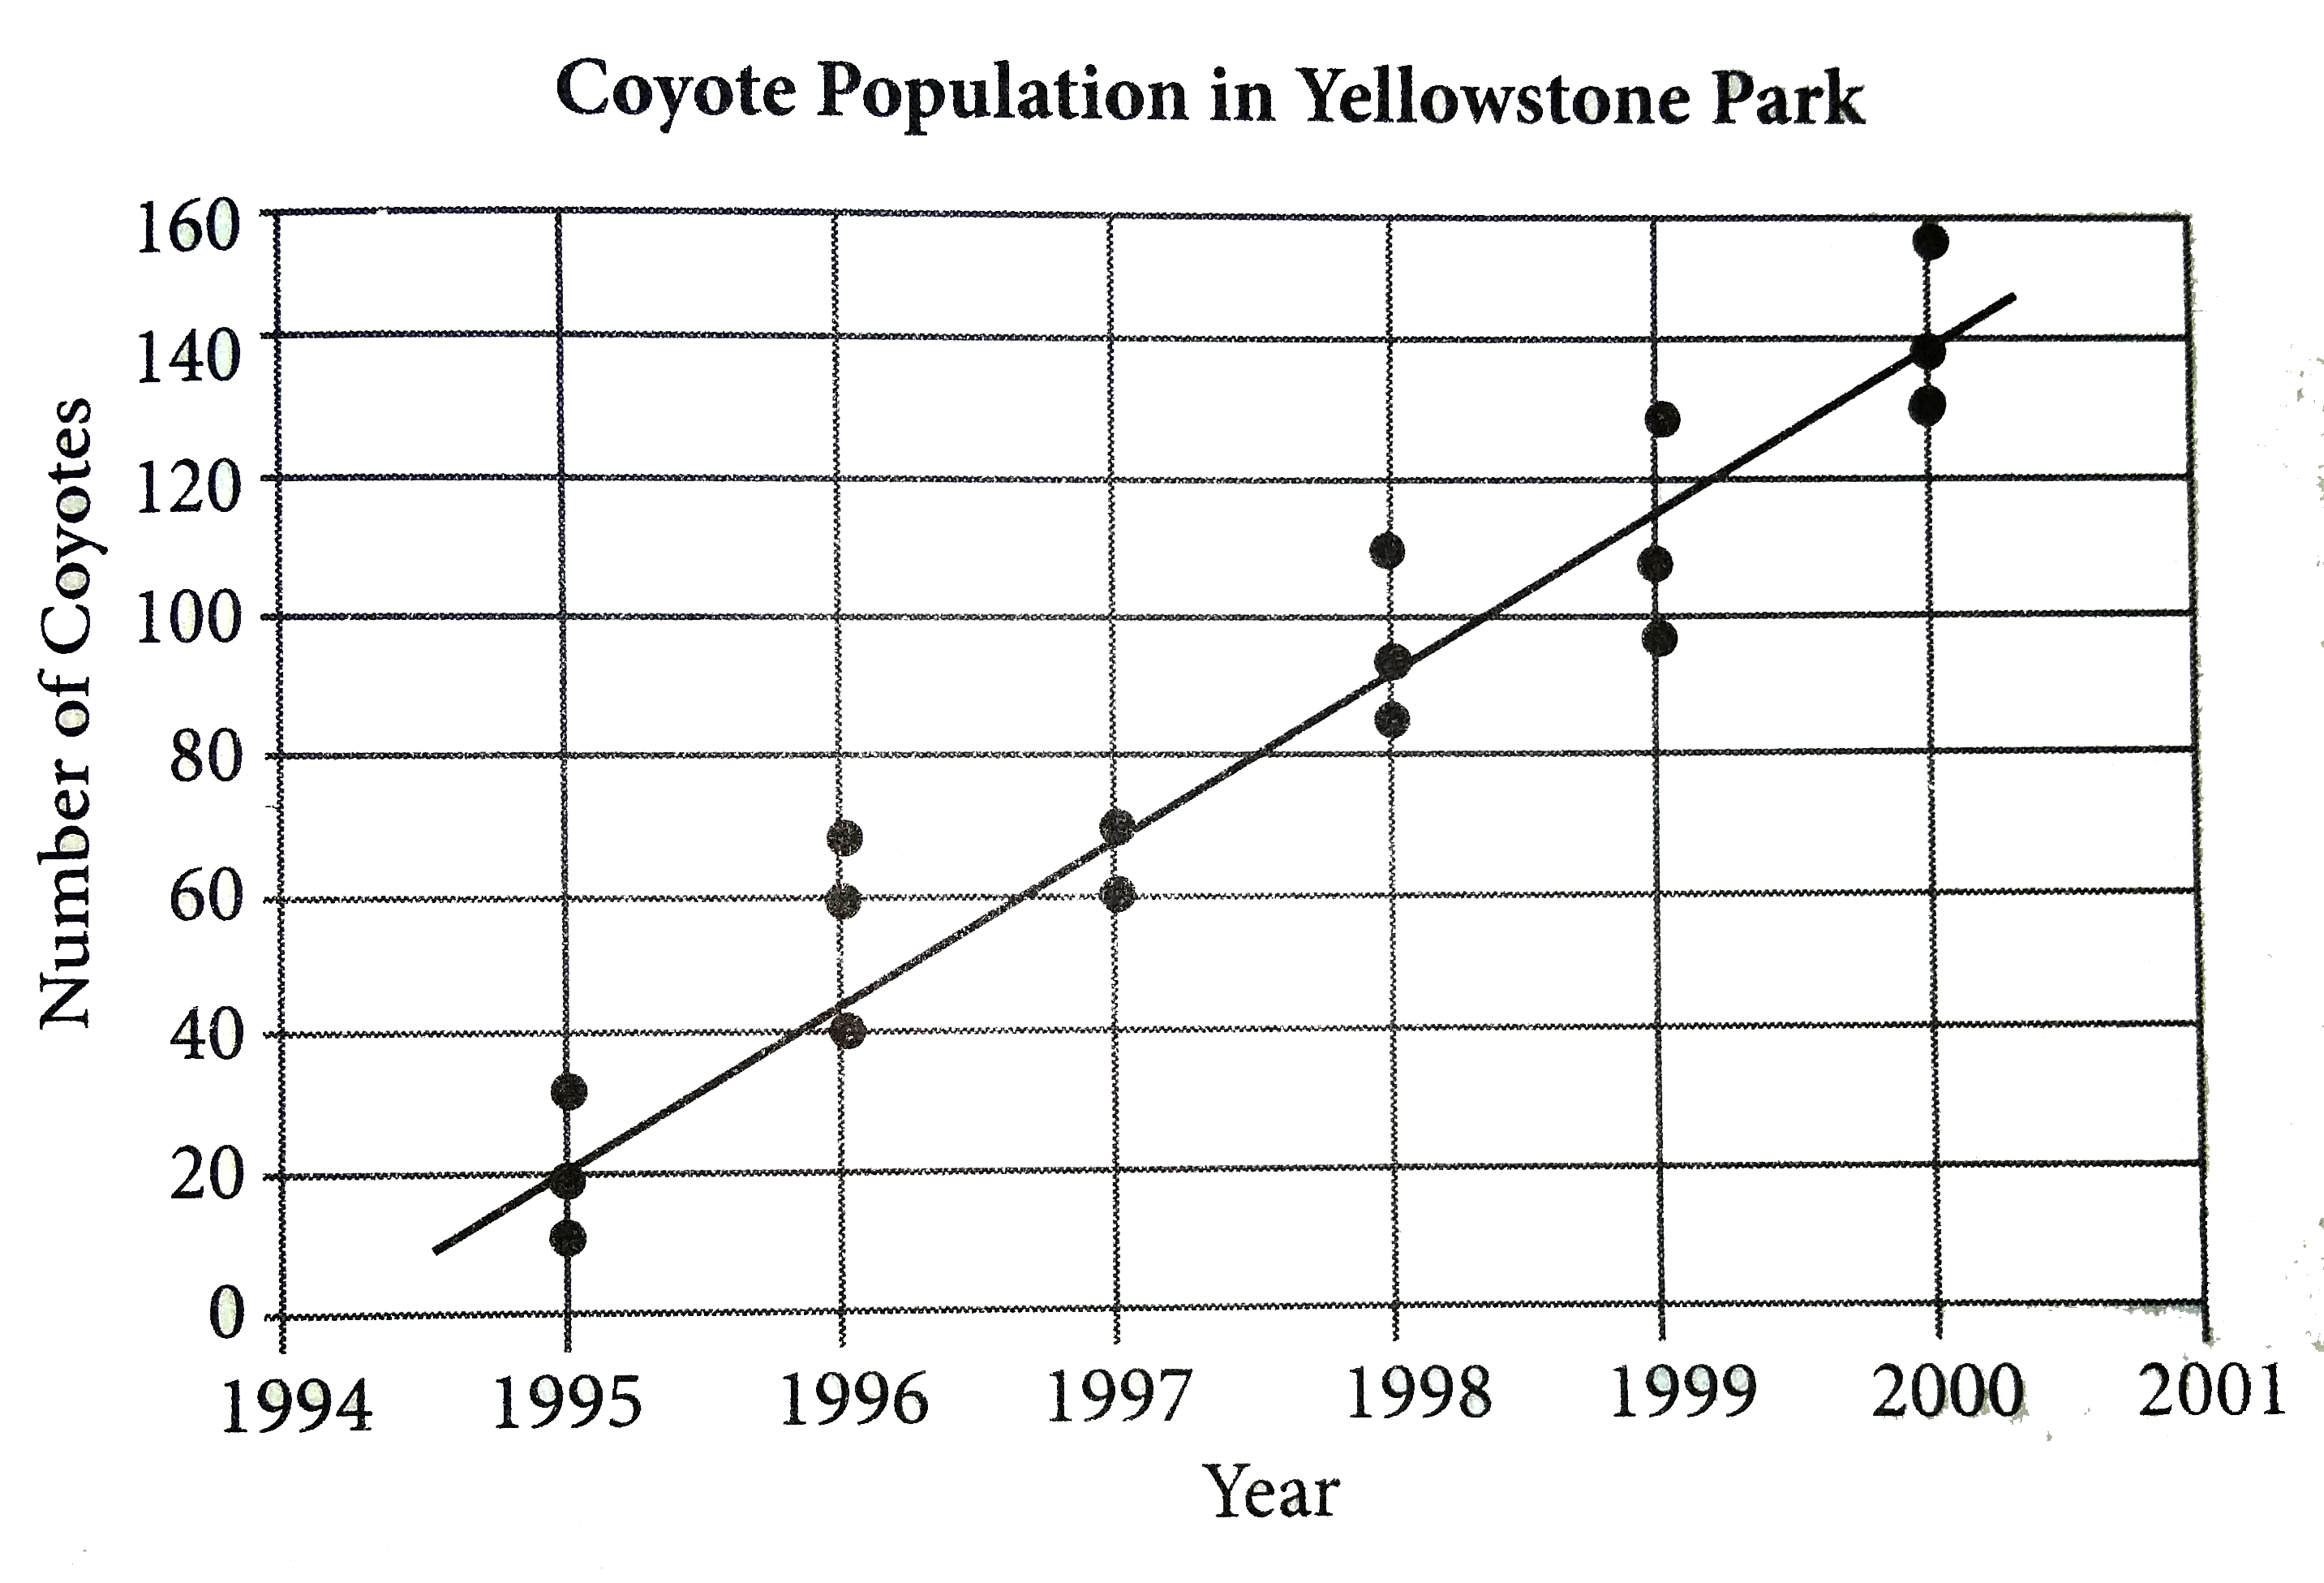
In the 1990s, the park rangers at Yellowstone National park implemented a program aimed at increasing the dwindling coyote population in Montana. Results of studies of the coyote population in the park are shown in the scatterplot below.

According to the data in the scatterplot, which of the following best represents the percent increase between the median of the results of the studies from 1995 and the median of the results of the studies from 1996?
A
0.5
B
1
C
1.5
D
2
Text Solution
The correct Answer is:D
|
Topper's Solved these Questions
Similar Questions
Knowledge Check
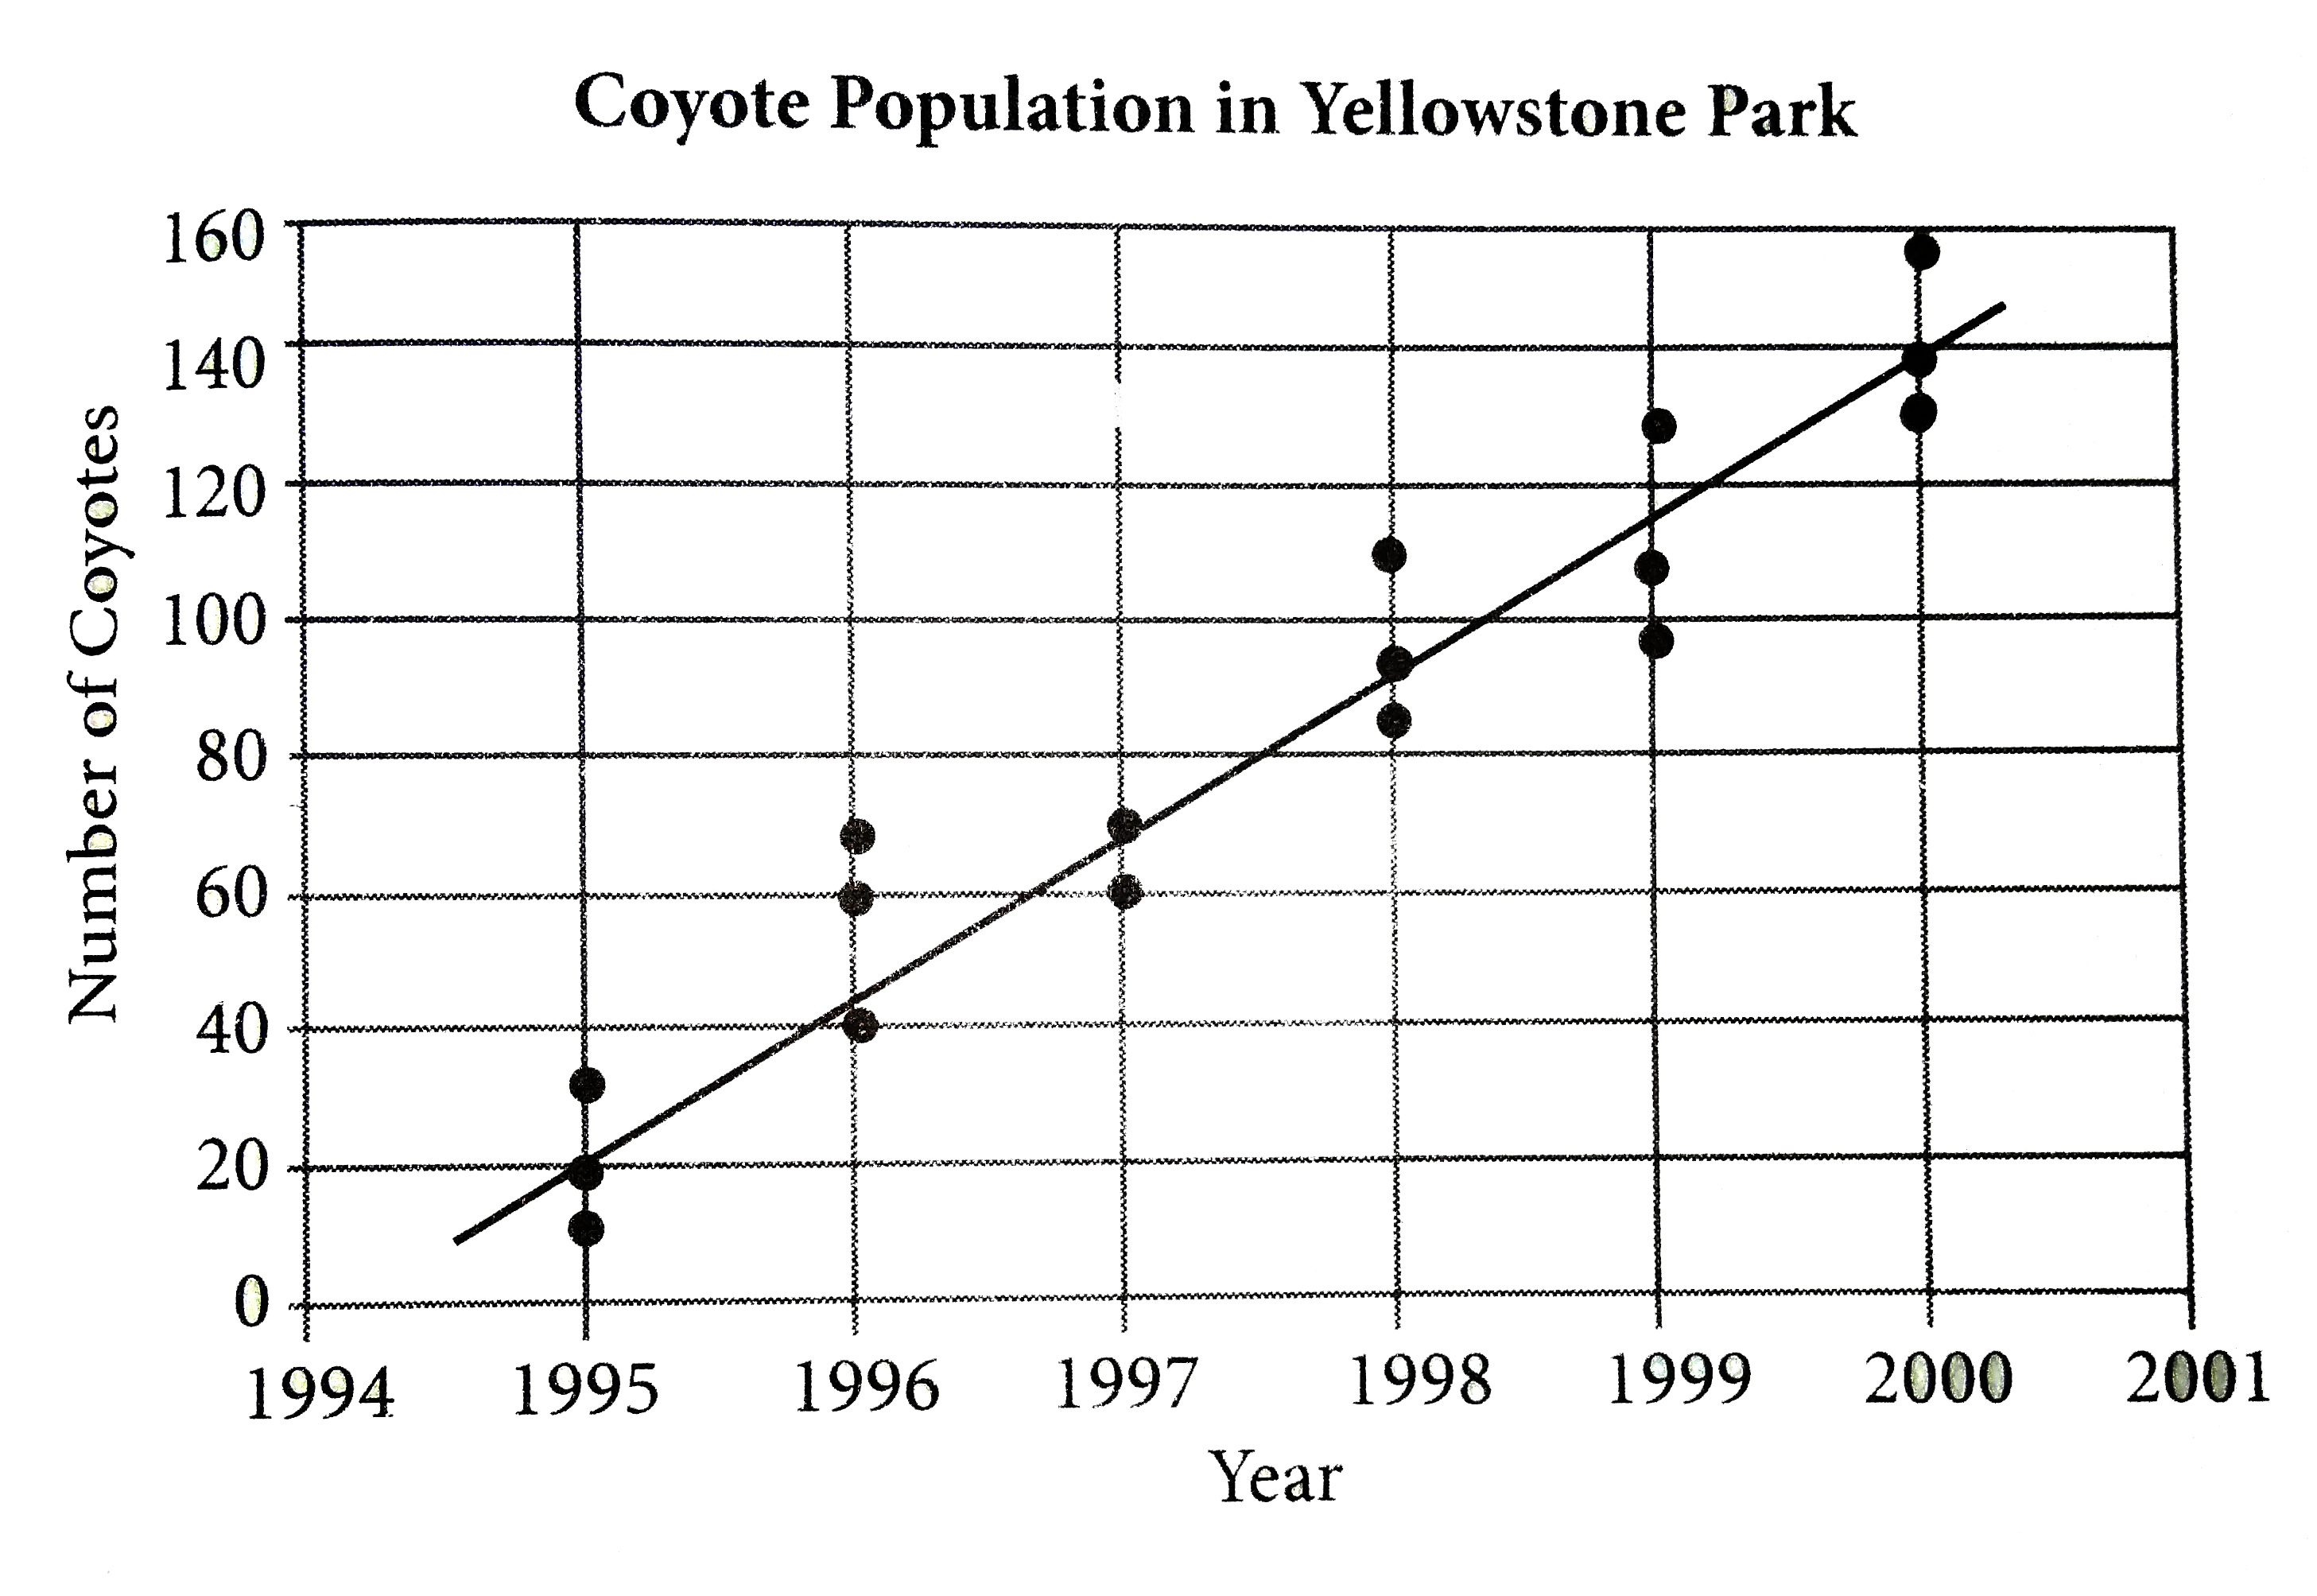
In the 1990s, the park rangers at Yellowstone National park implemented a program aimed at increasing the dwindling coyote population in Montana. Results of studies of the coyote population in the park are shown in the scatterplot below.

Based on the line of best fit in the scatterplot above, which of the following is the closest to the average annual increase in coyotes in Yellowstone Park between 1995 and 2000?A22B24C26D28Where is the Yellowstone National Park situated ?
AUnited KingdomBUnited StatesCFranceDSouth AfricaWhich of the following is true for national parks
ATourism is allowed in buffer zoneBNo human activity is allowedCHunting allowed in core zoneDCattle grazing is allowed in buffer zone
Which of the following statements about National park is correct?
View SolutionPanna National Park is located in which of the following
View SolutionIn which of the following states is the Chandoli National Park located?
View SolutionWhich one of the following is the first National Park established in India?
View SolutionIn which of the following states, Manas National Park is situated?
View Solution


