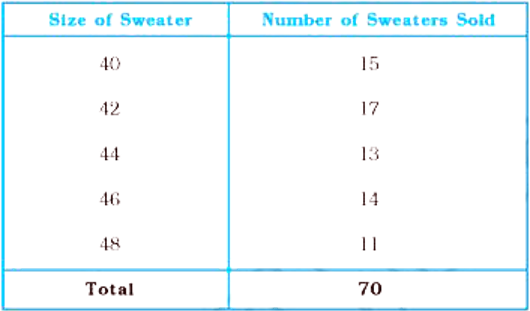
In the above table
(a) The most popular size is 17.
(b) 17 is the median for above data.
The correct Answer is:(a) false (b) false
Step by step video & image solution for In the above table (a) The most popular size is 17. (b) 17 is the median for above data. by Maths experts to help you in doubts & scoring excellent marks in Class 7 exams.
Updated on:21/07/2023Topper's Solved these Questions
- DATA HANDLINGBOOK - NCERT EXEMPLARCHAPTER - DATA HANDLINGEXERCISE - EXAMPLES
9 Videos
- DATA HANDLINGBOOK - NCERT EXEMPLARCHAPTER - DATA HANDLINGEXERCISE - EXERCISE(WRITE THE CORRECT ANSWER)
15 Videos
- DATA HANDLINGBOOK - NCERT EXEMPLARCHAPTER - DATA HANDLINGEXERCISE - EXAMPLES(FILL IN THE BLANKS)
2 Videos
- COMPARING QUANTITIESBOOK - NCERT EXEMPLARCHAPTER - COMPARING QUANTITIESEXERCISE - THINK AND DISCUSS
24 Videos
- EXPONENTS AND POWERSBOOK - NCERT EXEMPLARCHAPTER - EXPONENTS AND POWERSEXERCISE - EXERCISE
136 Videos
Similar Questions
The initial rate of reaction A+B→C, was measured for several concentration of A and B. The decomposition made are recorded in the following table.

Using the data in the above table, determine a) the rate law for the reason b) the magnitude of the rate constant.
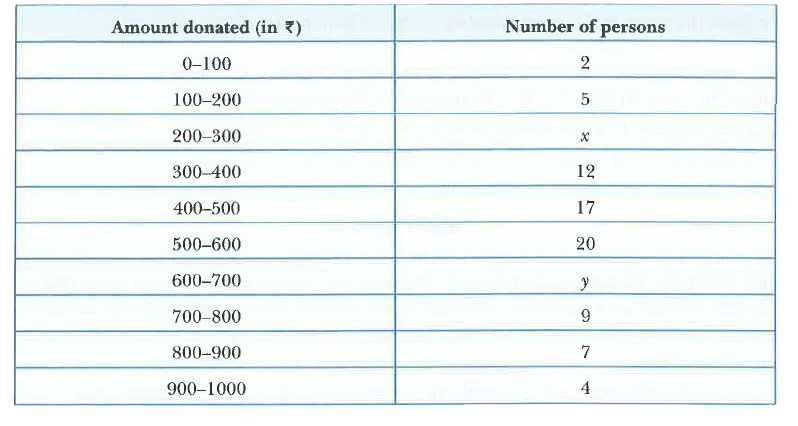
View SolutionThe following table shows the data of the amount donated by 100 people in a blind school.

If the median of the above data is 525, find the value of x and y.
What values are depicted here ?
View Solution
Knowledge Check

The optimal sequence for above data isACDBABDBCACBCDADABCDThe populations of four towns A, B, C and D as on 2001 are as follows:

What is the most appropriate diagram to present the above data?Apie chartBBar chartCHistogramDLine graph
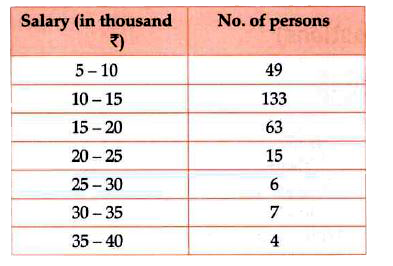
The table below show the salaries of 280 persons:
Calculate the median salary of the data.


View SolutionThe population of four towns A, B, C and D as on 2001 are as follows:

What is the most appropriate diagrams to present the above data?
View Solution
The optimum sequence for the above data is …….
View SolutionThe table below shows Salary of 280 persons. Calculate the median salary of the data.
View SolutionThe following table given the daily income of 50 workers of a factory :

Find the mean, mode nad median of above data.
View SolutionThe populations of four towns A, B, C and D as on 2001 are as follows:

What is the most appropriate diagram to present the above data?
View Solution
