(#KPL_SAT_MAT_PRP_PS_10_E01_003_Q01.png" width="80%">
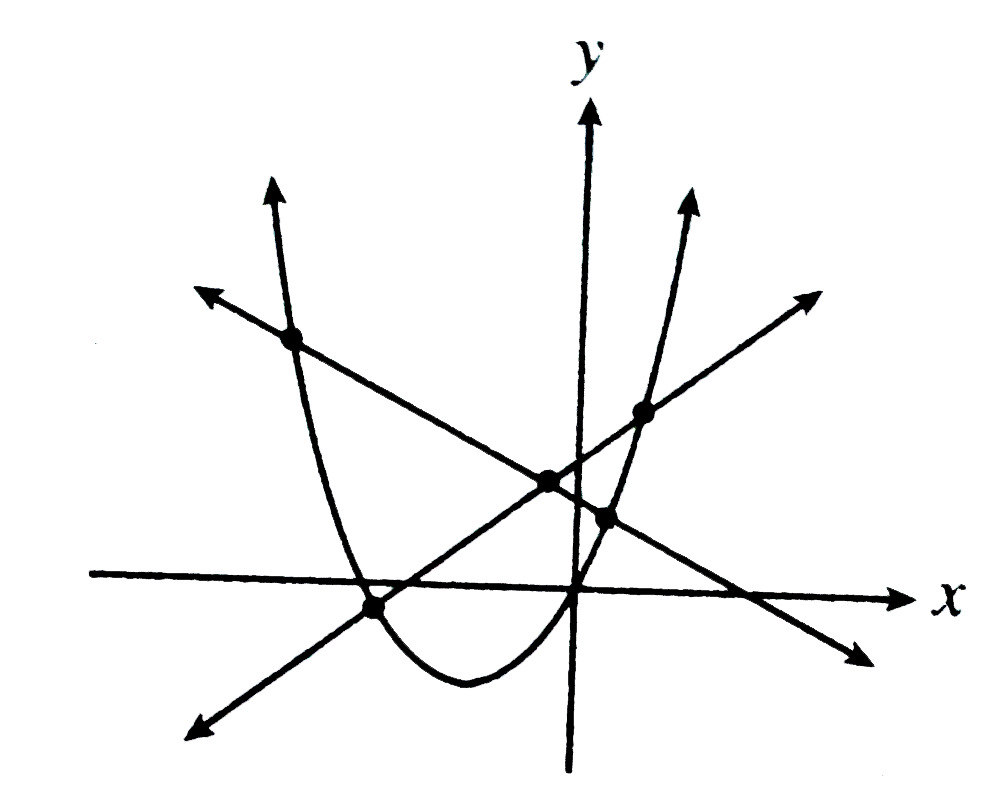
A system of three equation and their graphs are shown above. How many solutions does the system of equations have?
None
One
Two
Three
The correct Answer is:B
Difficult: Easy
Category: Passport to Advanced Math/ Quadratics
Strategy Advice: Graphically speaking, the solution to a system of equations is the point or points where ALL the graphs intersect.
Getting to the Answer: There is only one point on the graph where all three equations intersect (1, 4). Therefore, (B) is the correct answer.
Topper's Solved these Questions
Similar Questions
Knowledge Check

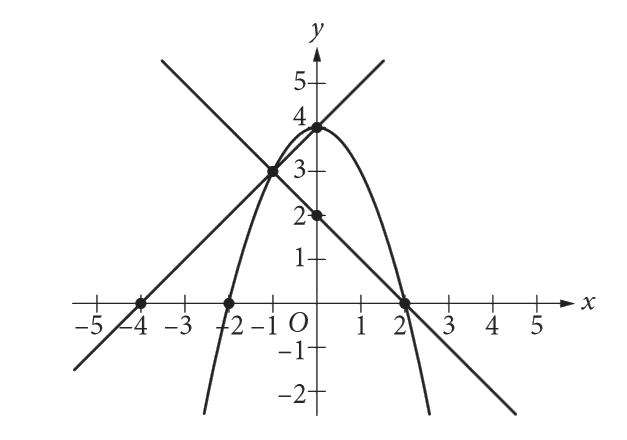
A system of three equations is shown graphically in the xy-plane above. How many solutions does the system have ?A0B2C3D5
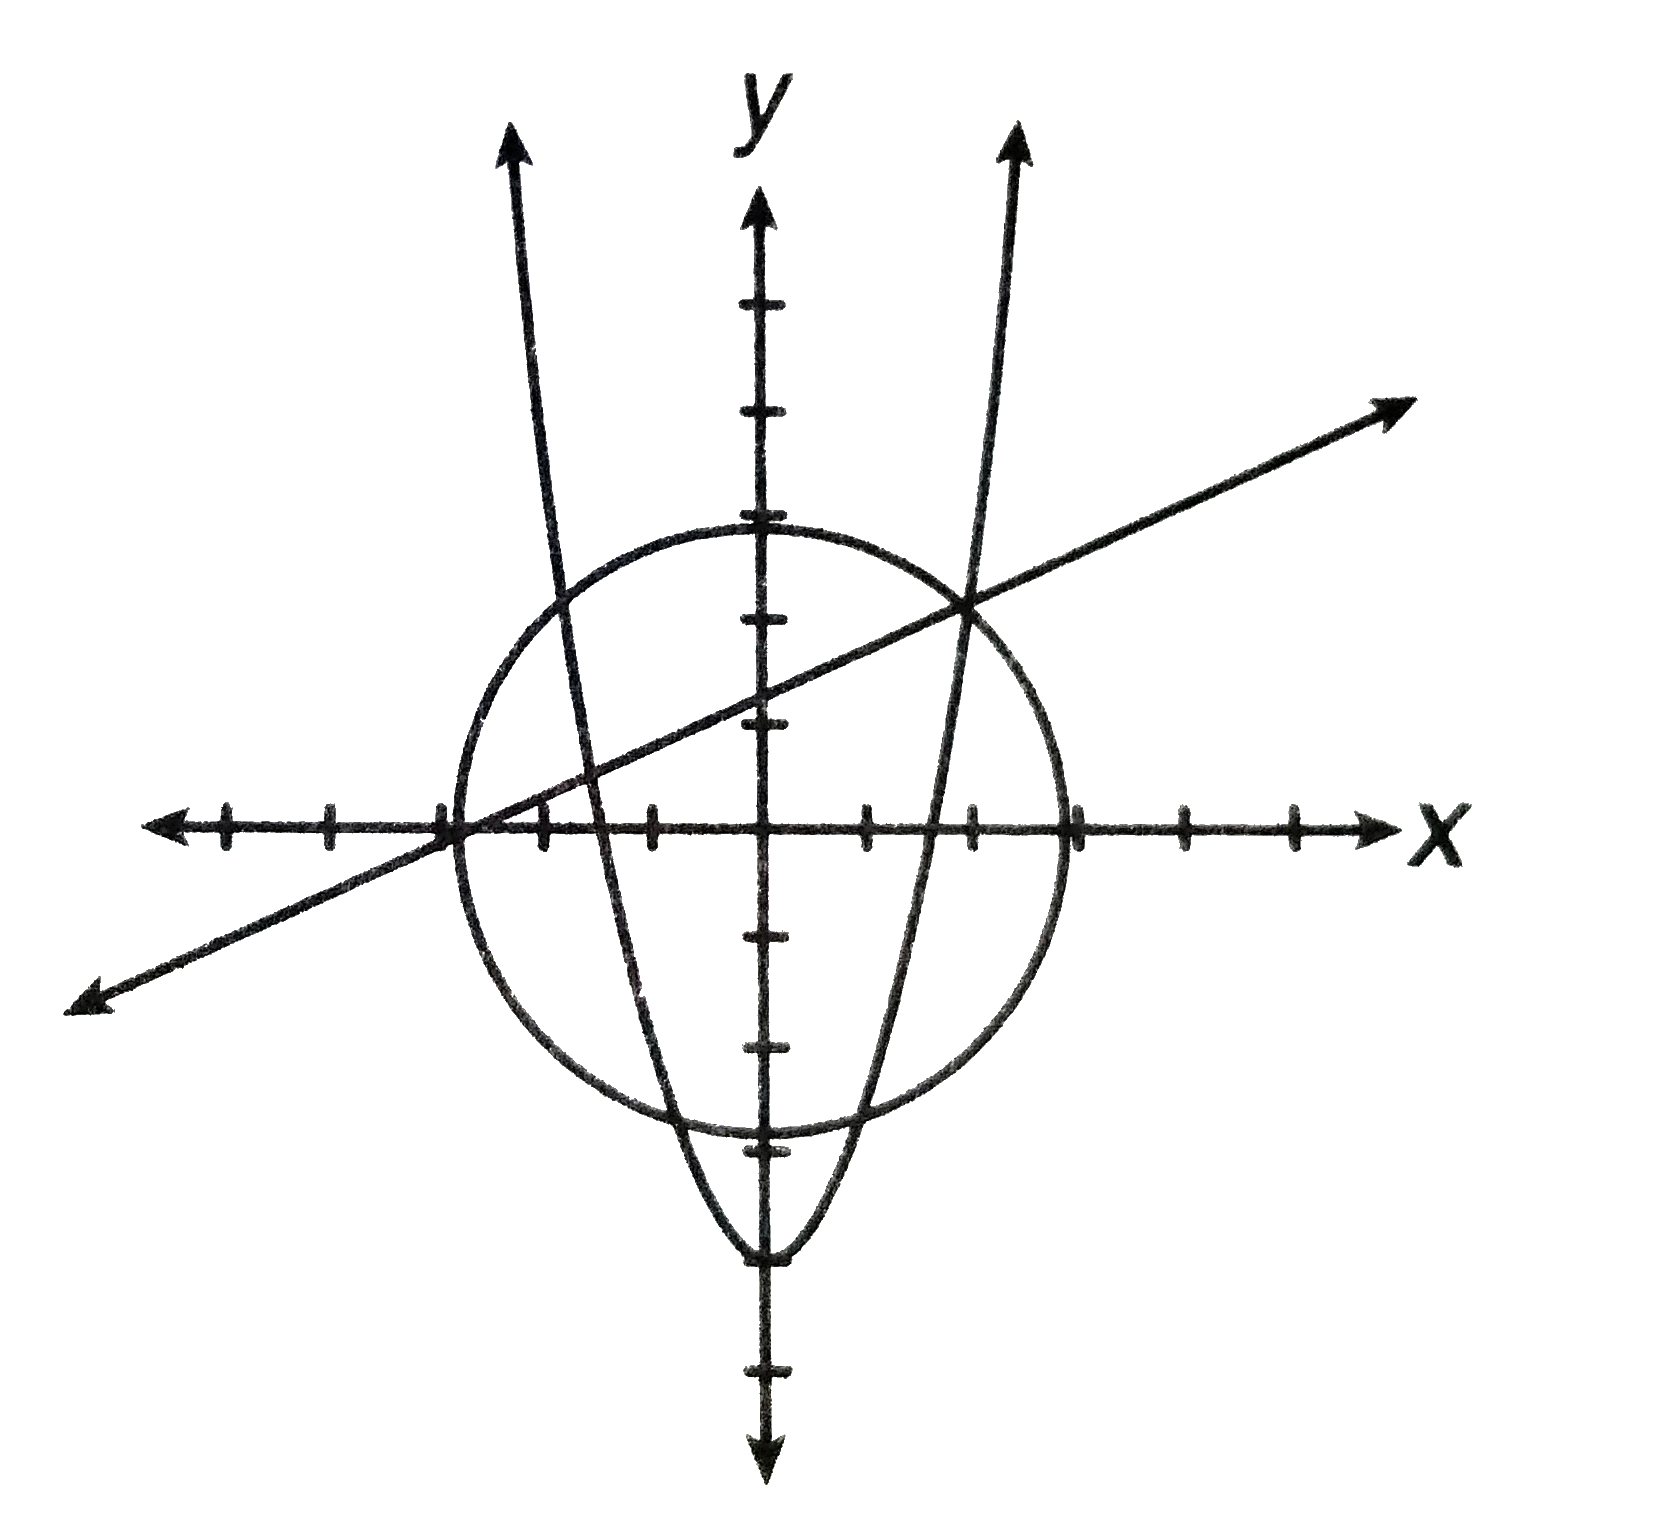
A system of three equations whose graph in the xy-plane are a line, a circle, and a parabola are shown above. How many solutions does the system have?A0B1C2D4
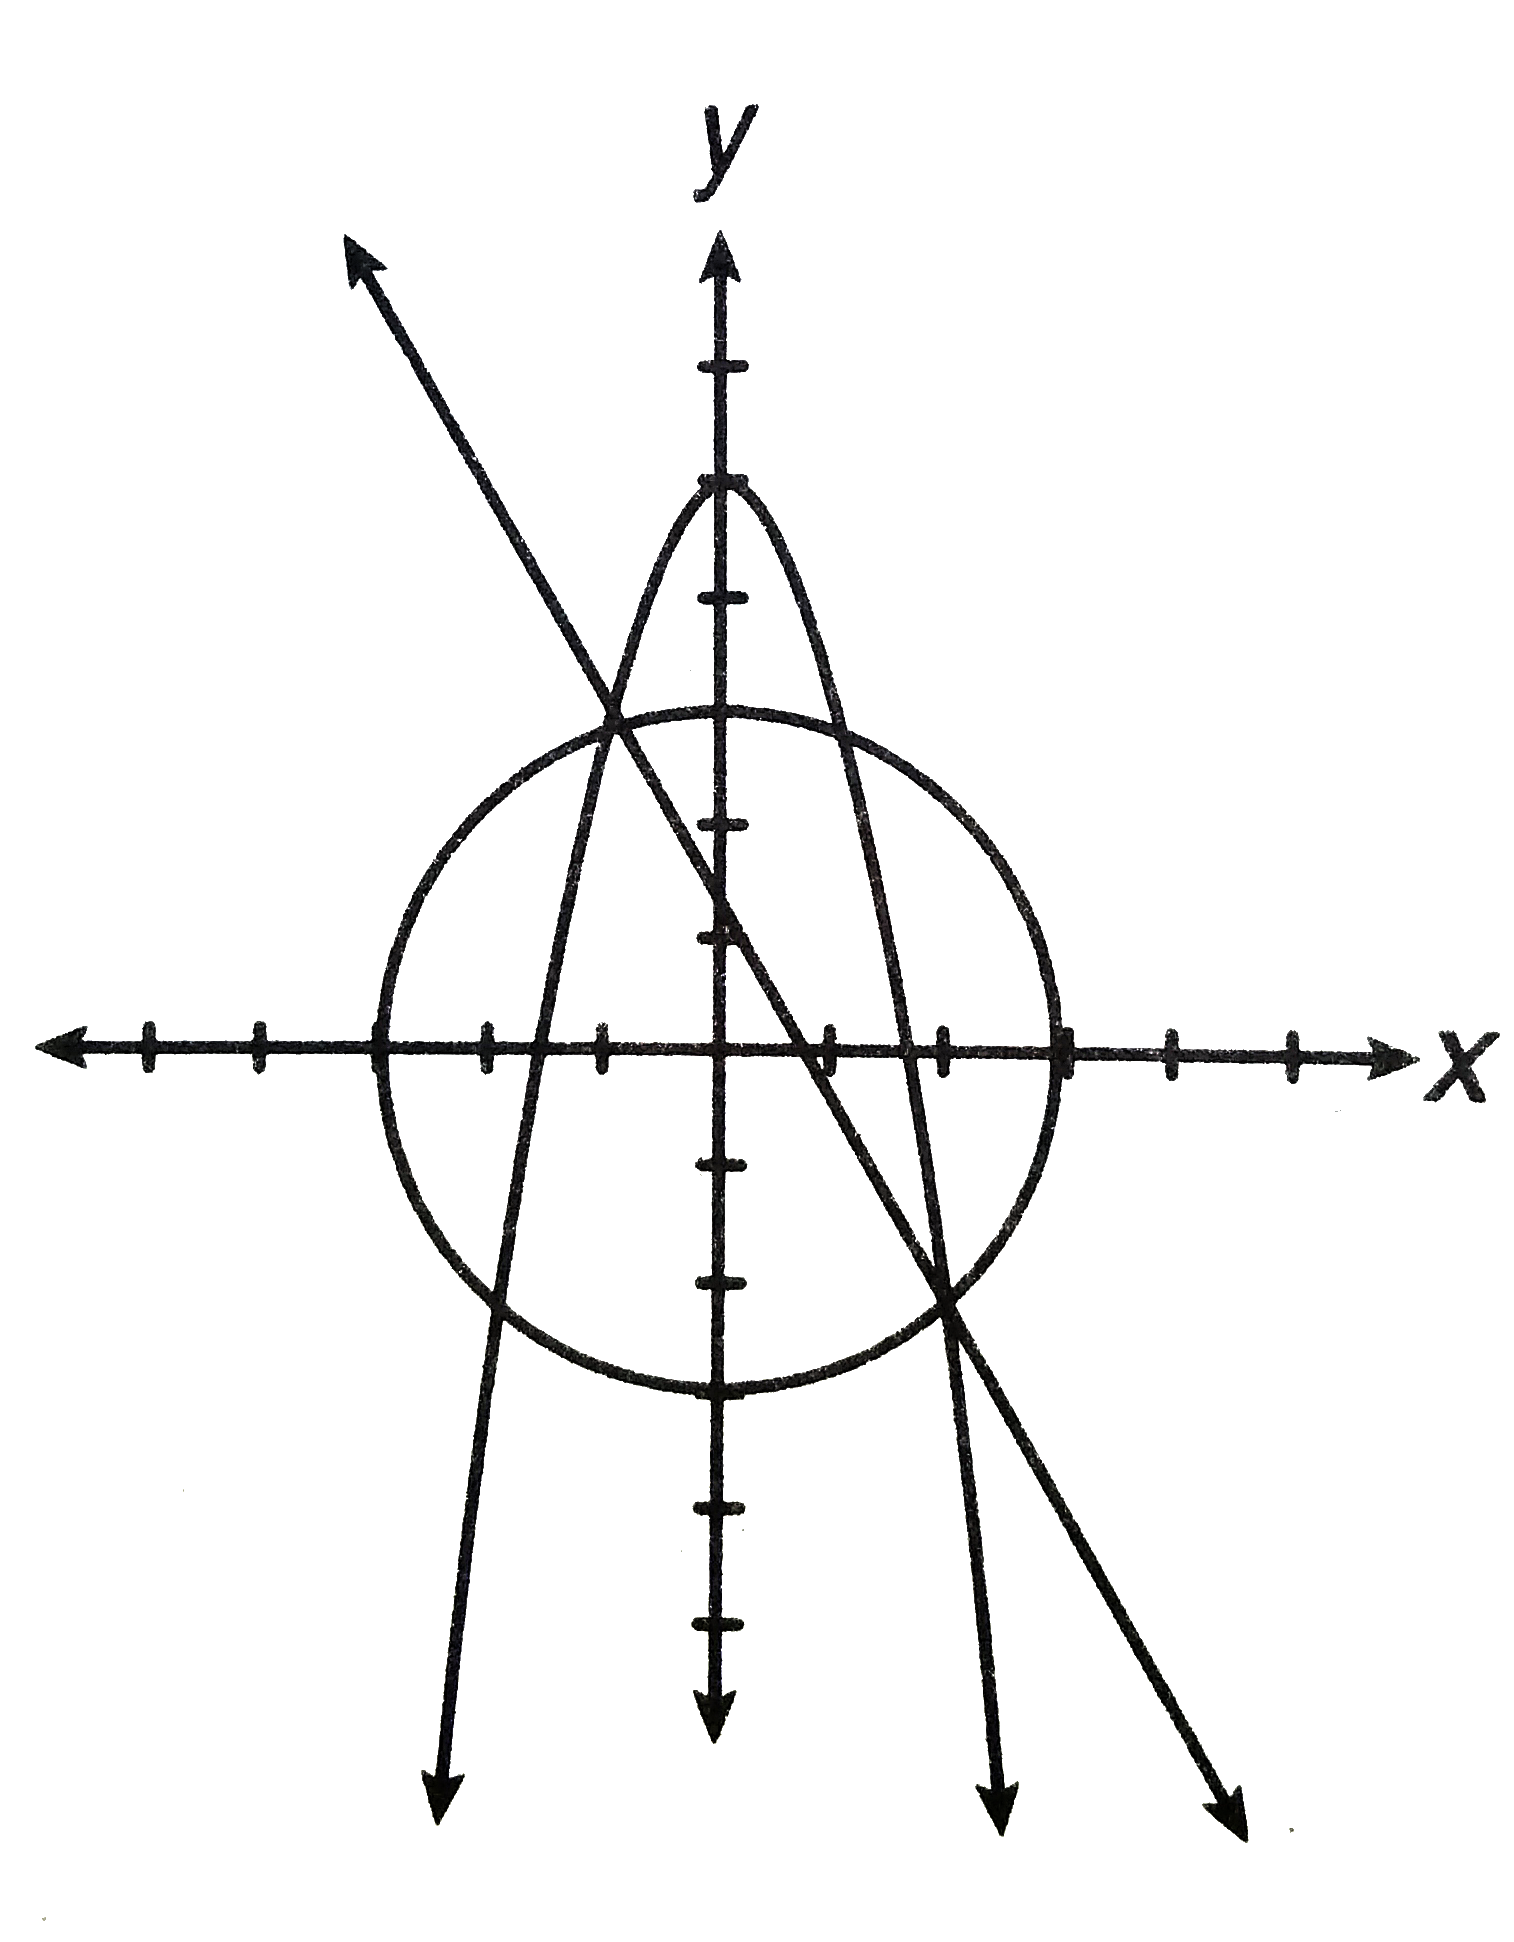
A system of three equations whose graphs in the xy-plane are a line, a circle, and a parabola is shown above. How many solutions does the system have?A1B2C3D4
In the figure shown
(##AHT_PGT_PHY_C10_E01_006_Q01.png" width="80%">
View SolutionIn figure ,PR = ?
(##CEN_JEE_MAT_X_C14_E01_032_Q01.png" width="80%">
View Solution(##KPL_SAT_PRD_PLS_C09_E01_006_Q01.png" width="80%">
Scientists measured the concentration of an exprerimental medication in blood samples over time. If a quadratic function is used to model the data, which of following best explains th meaning of the vertex ?
View Solution(##KPL_SAT_PRD_PLS_C09_E01_001_Q01.png" width="80%">
The scatterplot shows the prevalence of obesity plotted against the prevalence of diabetes in various ares of the United States. Which of the following best estimates the average rate of change in the prevalence of diabetes as comared to the prevalence of obesity ?
View SolutionMatch the following ( ##AAK_MCP_10_NEET_BOT_E10_027_Q01.png" width="80%">
View Solution

