(##KPL_SAT_PRD_PLS_C09_E01_004_Q01.png" width="80%">
The scaterplot abouve shows data collected each year after the British Parlimament enacted a mandatory seat belt law and line of beast fit to the data. Which of the following equations best represents the trend of the data shown in the figure ?
y=0.4x+25
y=1.8x+15
y=2.1x+35
y=2.6x+25
The correct Answer is:D
A line that "represents the tread of the data" is another way of refereing to the line of best fit, which is linear in this diagram. Use the y-intercept and slope of the line of best fit to eliminate the choices. Start by finding the y-intercept. For this graph, it's about 25, so eliminate (B) and (C ). To choose between (A) and (D) find the approximate slope using two points that lie on (or very close to) the line of best fit. Use the y-intercept, (0,25), as one of the points to save time (it's easy to subtract 0) and estimate the second, such as (21, 80), Then, use the slope formula to find the slope:
m=y2−y1x2−x1=80−2521−0=5521=2.62
The results is very close to the slope is (D), making it the correct answer.
Topper's Solved these Questions
- BOOK - KAPLANCHAPTER - SCATTERPLOTSEXERCISE - TRY ON YOUR OWN20videos
SCATTERPLOTS
- BOOK - KAPLANCHAPTER - SCATTERPLOTSEXERCISE - LINE OF BEST FIT1videos
SCATTERPLOTS
- BOOK - KAPLANCHAPTER - SAT MATH: TIMING ANS SECTION MANAGEMENT STRATEGIESEXERCISE - TRY ON YOU OWN5videos
SAT MATH: TIMING ANS SECTION MANAGEMENT STRATEGIES
- BOOK - KAPLANCHAPTER - SYSTEMS OF LINEAR EQUATIONSEXERCISE - NUMBER OF POSSIBLE SOLUTIONS1videos
SYSTEMS OF LINEAR EQUATIONS
Similar Questions

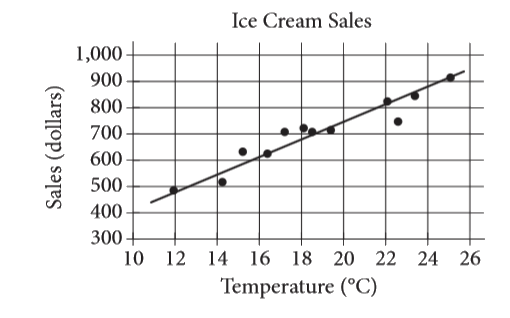
The scatterplot above shows a company’s ice cream sales d, in dollars, and the high temperature t, in degrees Celsius (.∘C), on 12 different days. A line of best fit for the data is also shown. Which of the following could be an equation of the line of best fit?View SolutionTwo friends Seema and Aditya work in the same office at Delhi. In the Christmas vacations, both decided to go to their hometowns represented by Town A and Town B respectively in the figure given below. Town A and Town B are connected by trains from the same station C (in the given figure)in Delhi.Based on the given situation, answer the following questions:
img src="https://d10lpgp6xz60nq.cloudfront.net/physics_images/MATH_041_X_SQP_E03_007_Q01.png" width="80%"gt
(i) Who will travel more distance, Seema or Aditya, to reach to their hometown?
(ii) Seema and Aditya planned to meet at a location D situated at a point D represented by the mid-point of the line joining the points represented by Town A and Town B. Find the coordinates of the point represented by the point D .
(iii) Find the area of the triangle formed by joining the points represented by A, B and C.View Solution
Knowledge Check
- Question 1 - Select One
(##KPL_SAT_PRD_PLS_C09_E01_001_Q01.png" width="80%">
The scatterplot shows the prevalence of obesity plotted against the prevalence of diabetes in various ares of the United States. Which of the following best estimates the average rate of change in the prevalence of diabetes as comared to the prevalence of obesity ?A0.3B0.9C1.1D3 - Question 2 - Select One
(##KPL_SAT_PRD_PLS_C09_E01_006_Q01.png" width="80%">
Scientists measured the concentration of an exprerimental medication in blood samples over time. If a quadratic function is used to model the data, which of following best explains th meaning of the vertex ?AThe average maximum medicine concentration in the blood sample is 7.5 units.BThe average maximum medicine concentration is more than 20 units.CThe average maximum medicine concentration in the blood samples occurs around 2.5 minutes.DThe average maximum medicine concentration in the blood sample occurs bgetween 5 and 10 minutes. - Question 3 - Select One
(#KPL_SAT_MAT_PRP_PS_10_E01_003_Q01.png" width="80%">
A system of three equation and their graphs are shown above. How many solutions does the system of equations have?ANoneBOneCTwoDThree
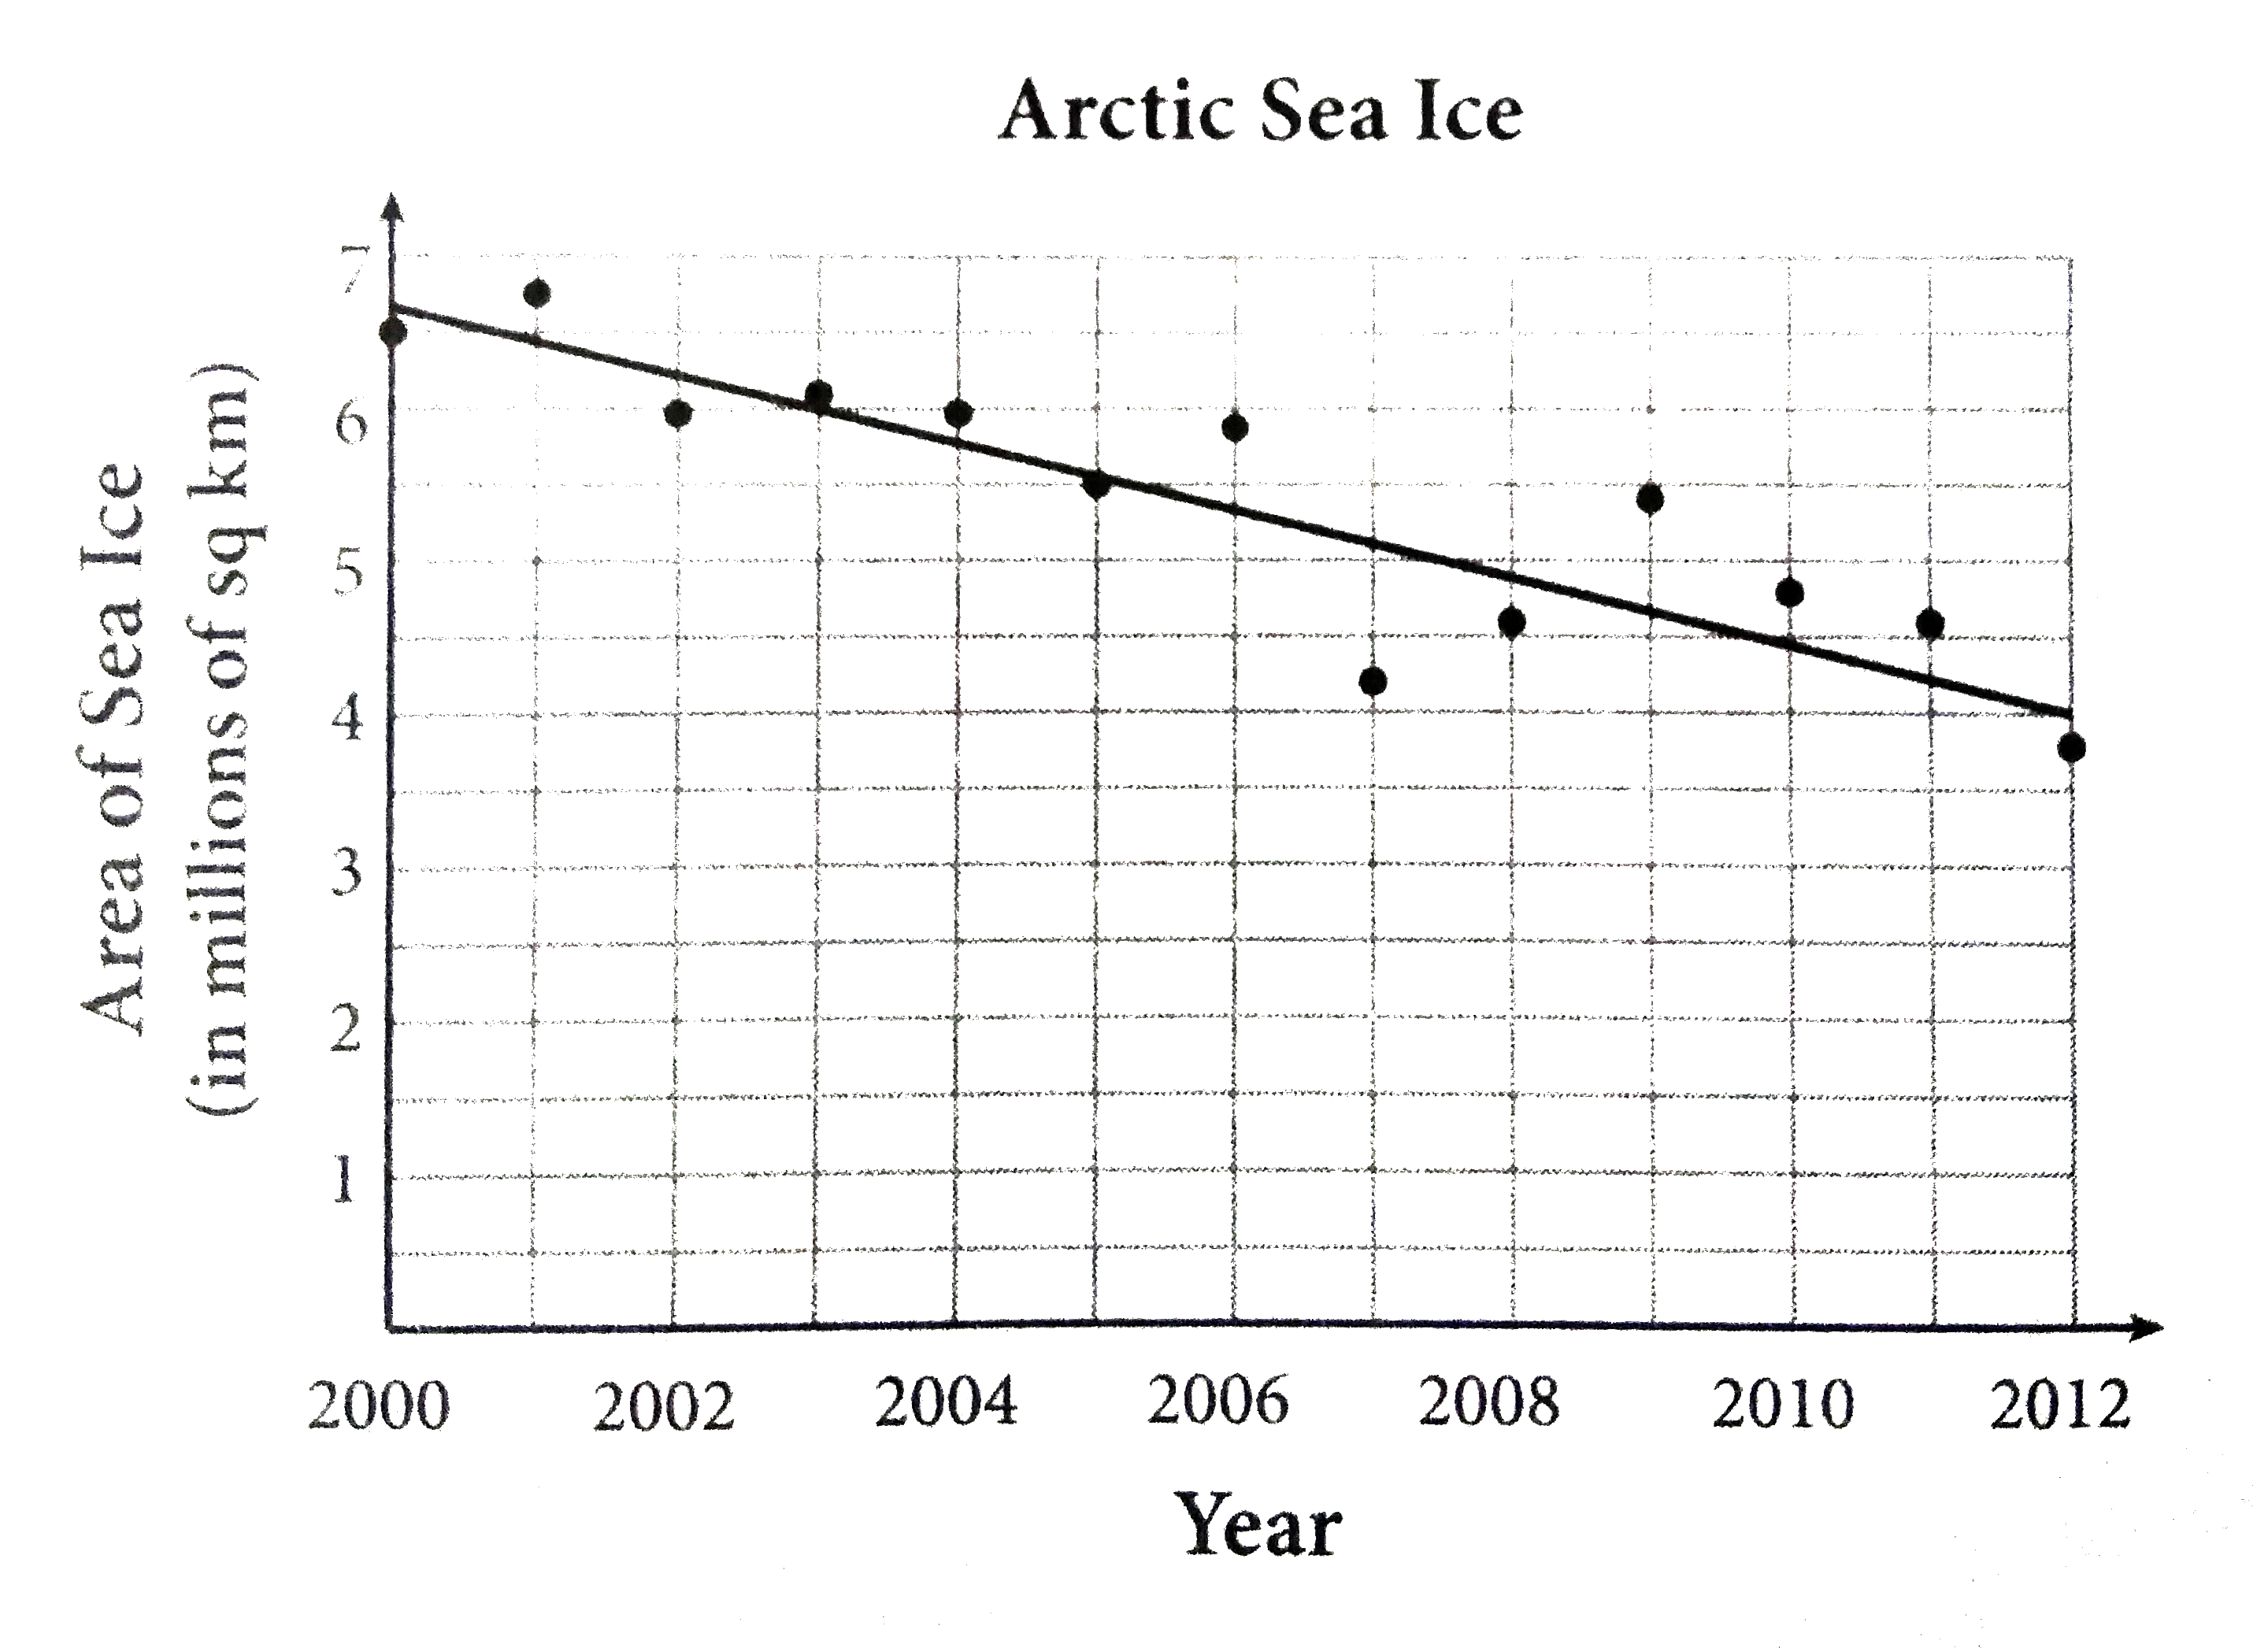
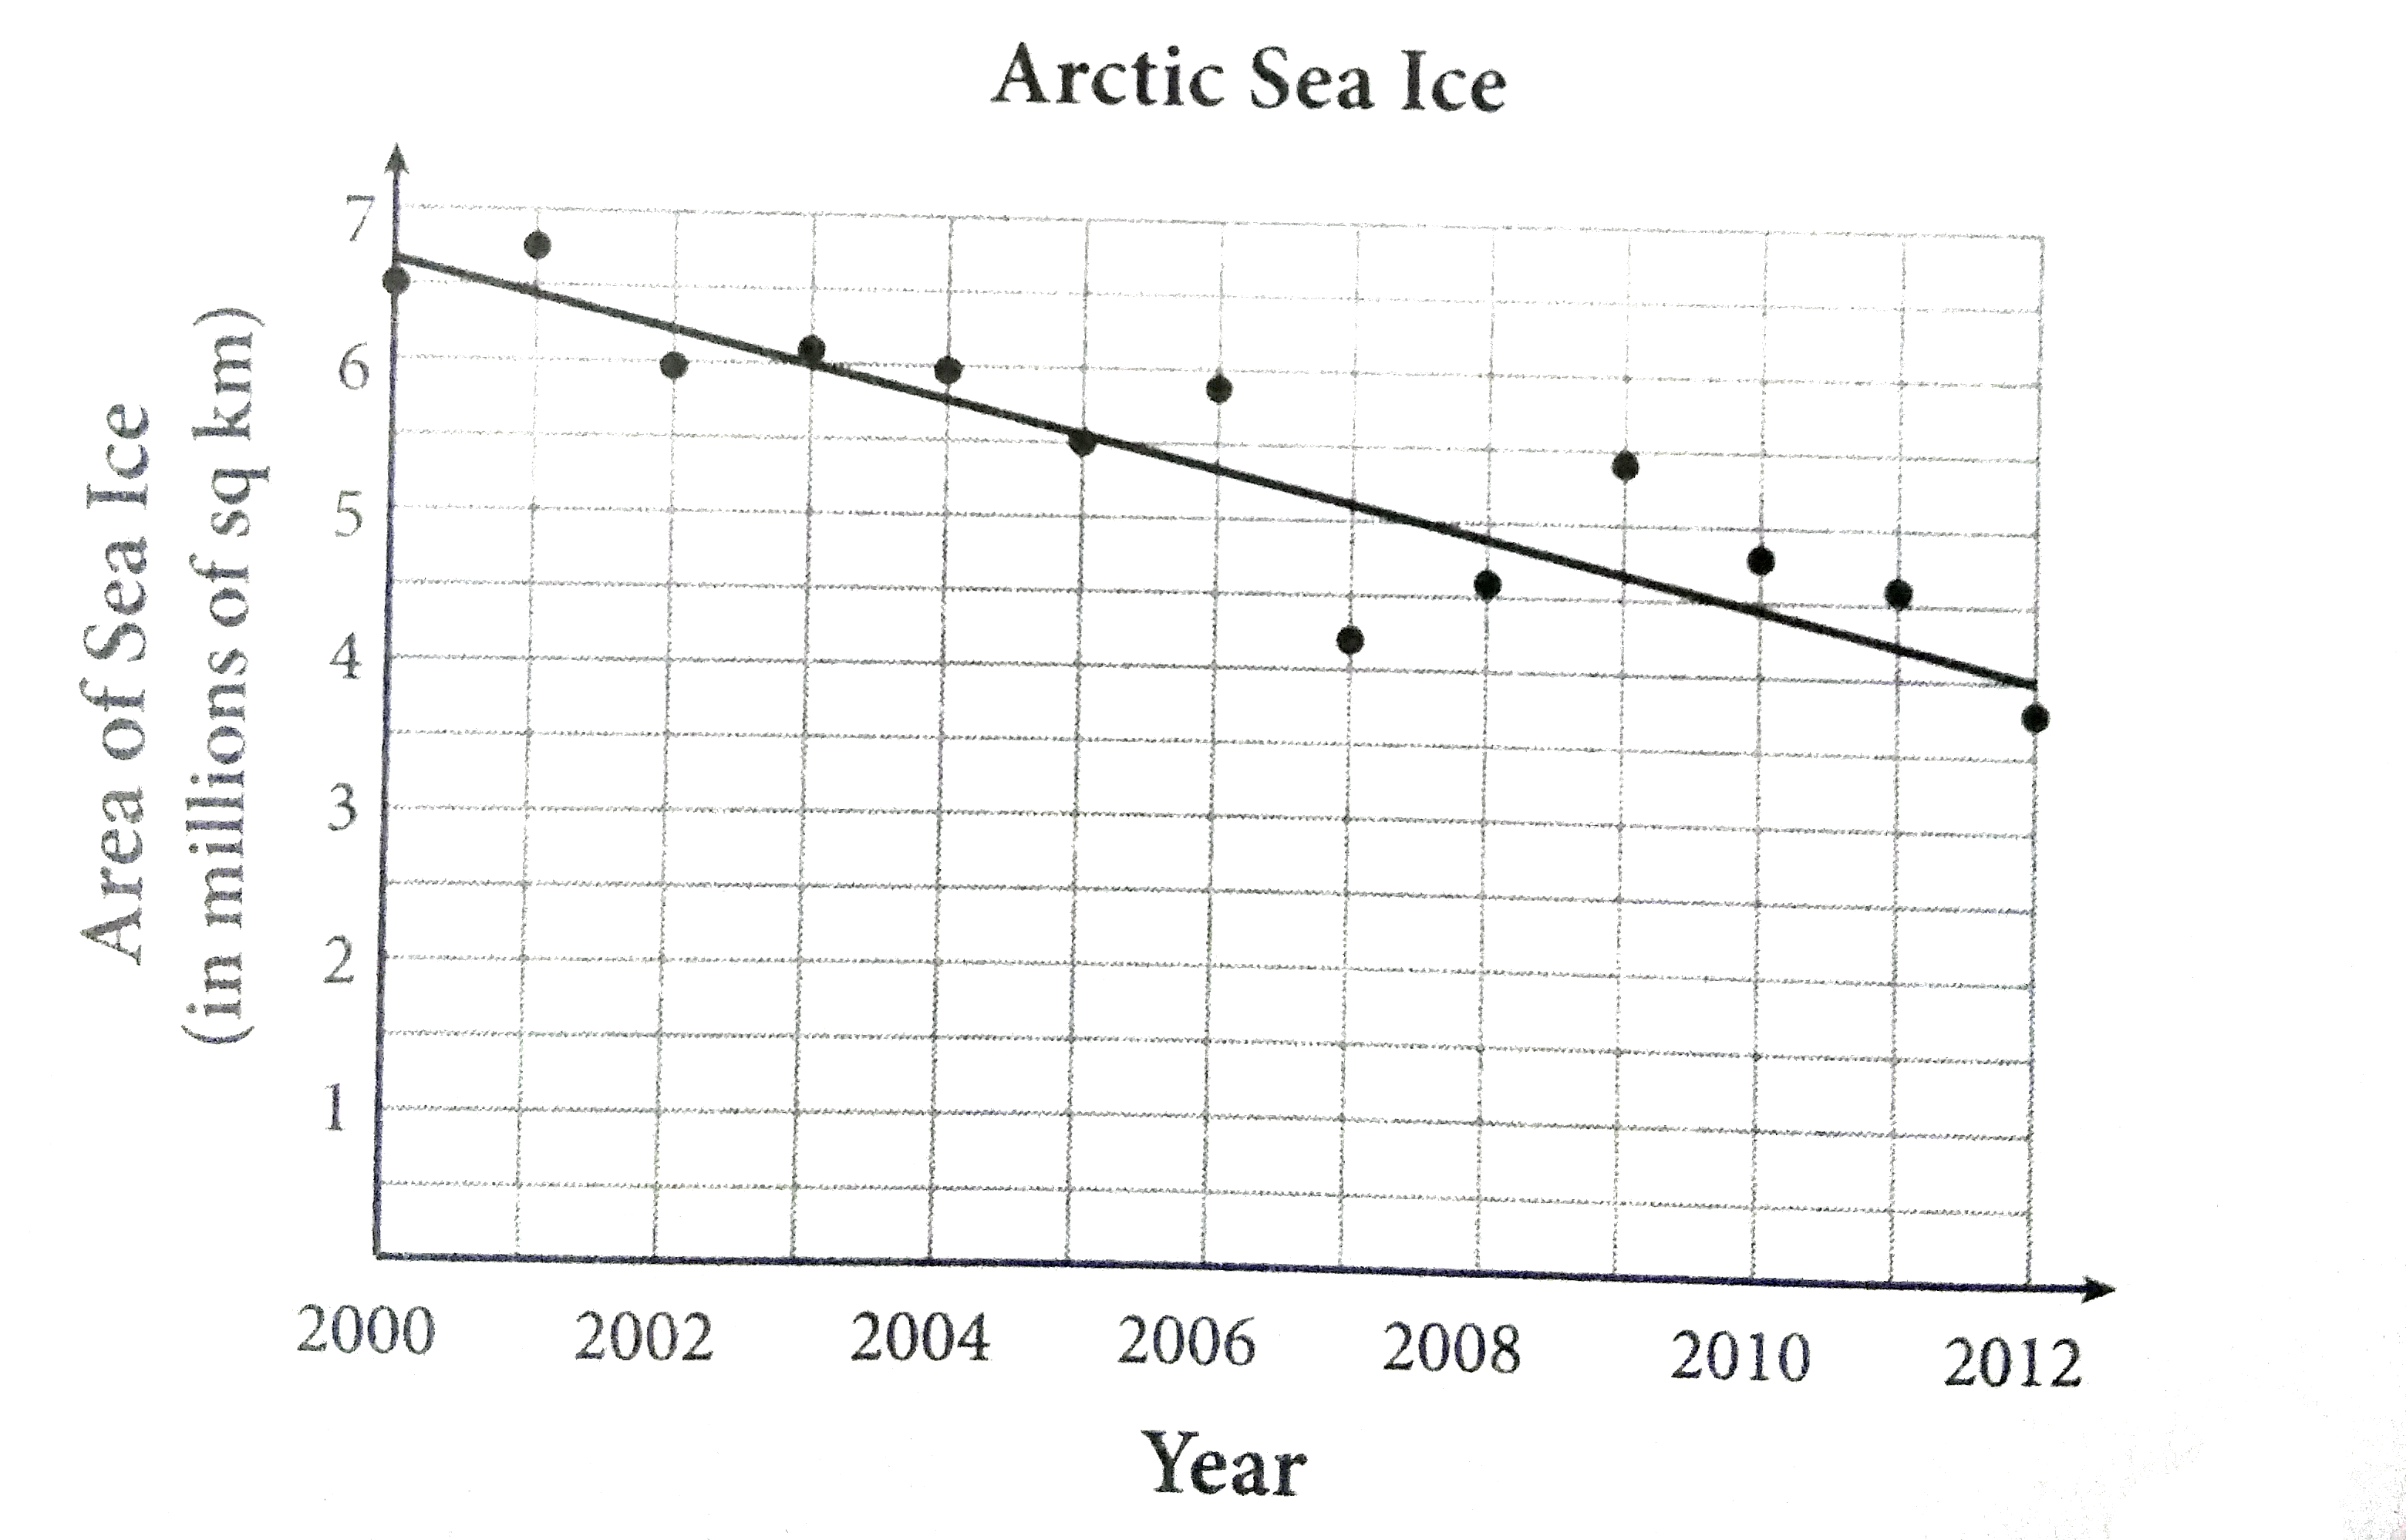
Sea ice extent is a measurement of the area of ocean with at least 15% sea ice. The graph below shows data for the extent of Artic sea ice between 2000 and 2012 as reported by the National Snow and Ice Data Center. The line of best fit is also shown. The equations of the line is A(t)=−0.187t+380.5, where A(t) represents the area of measurement sea ice in the Artic Ocean in the year t.

Q. Assuming the trend of the data continues in what year will the measurable sea ice in the Arctic Ocean cease to exist?View SolutionSea ice extent is a measurement of the area of ocean with at least 15% sea ice. The graph below shows data for the extent of Artic sea ice between 2000 and 2012 as reported by the National Snow and Ice Data Center. The line of best fit is also shown. The equations of the line is A(t)=−0.187t+380.5, where A(t) represents the area of measurement sea ice in the Artic Ocean in the year t.

Q. Based on the equation of the line of best fit, which of the following statements accurately of measurable Arctic sea ice during the given times period?View SolutionSea ice extent is a measurement of the area of ocean with at least 15% sea ice. The graph below shows data for the extent of Artic sea ice between 2000 and 2012 as reported by the National Snow and Ice Data Center. The line of best fit is also shown. The equations of the line is A(t)=−0.187t+380.5, where A(t) represents the area of measurement sea ice in the Artic Ocean in the year t.

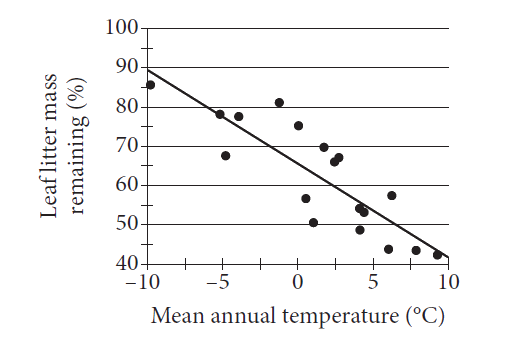
Q. Assuming the trand of the data continues, what is the predicted area, in millions of square kilometers, of measurable Arctic sea ice in the year 2020?View SolutionThe figure below shows the relationship between the percent of leaf litter mass remaining after decomposing for 3 years and the mean annual temperature, in degrees Celsius (.∘C), in 18 forests in Canada. A line of best fit is also shown.

A particular forest in Canada, whose data is not included in the figure, had a mean annual temperature of −2∘C. Based on the line of best fit, which of the following is closest to the predicted percent of leaf litter mass remaining in this particular forest after decomposing for 3 years?View Solution(##KPLSATPRDPLSC09E01002_Q01.png width=80%><br>W∈dχll,ameasurementtˆreflactsthetemperaturetˆo≠feelswhenoutsbasedontheactualtemperatureandthew∈dspeed,wasfirst∫roduced∈1939,andtheforμlawasrevised∈2001.Iftheoutstemperatureis0^(@)F, what is the approximate wind chill at 40 miles per hour based on the 2001 formula ?
View Solution

