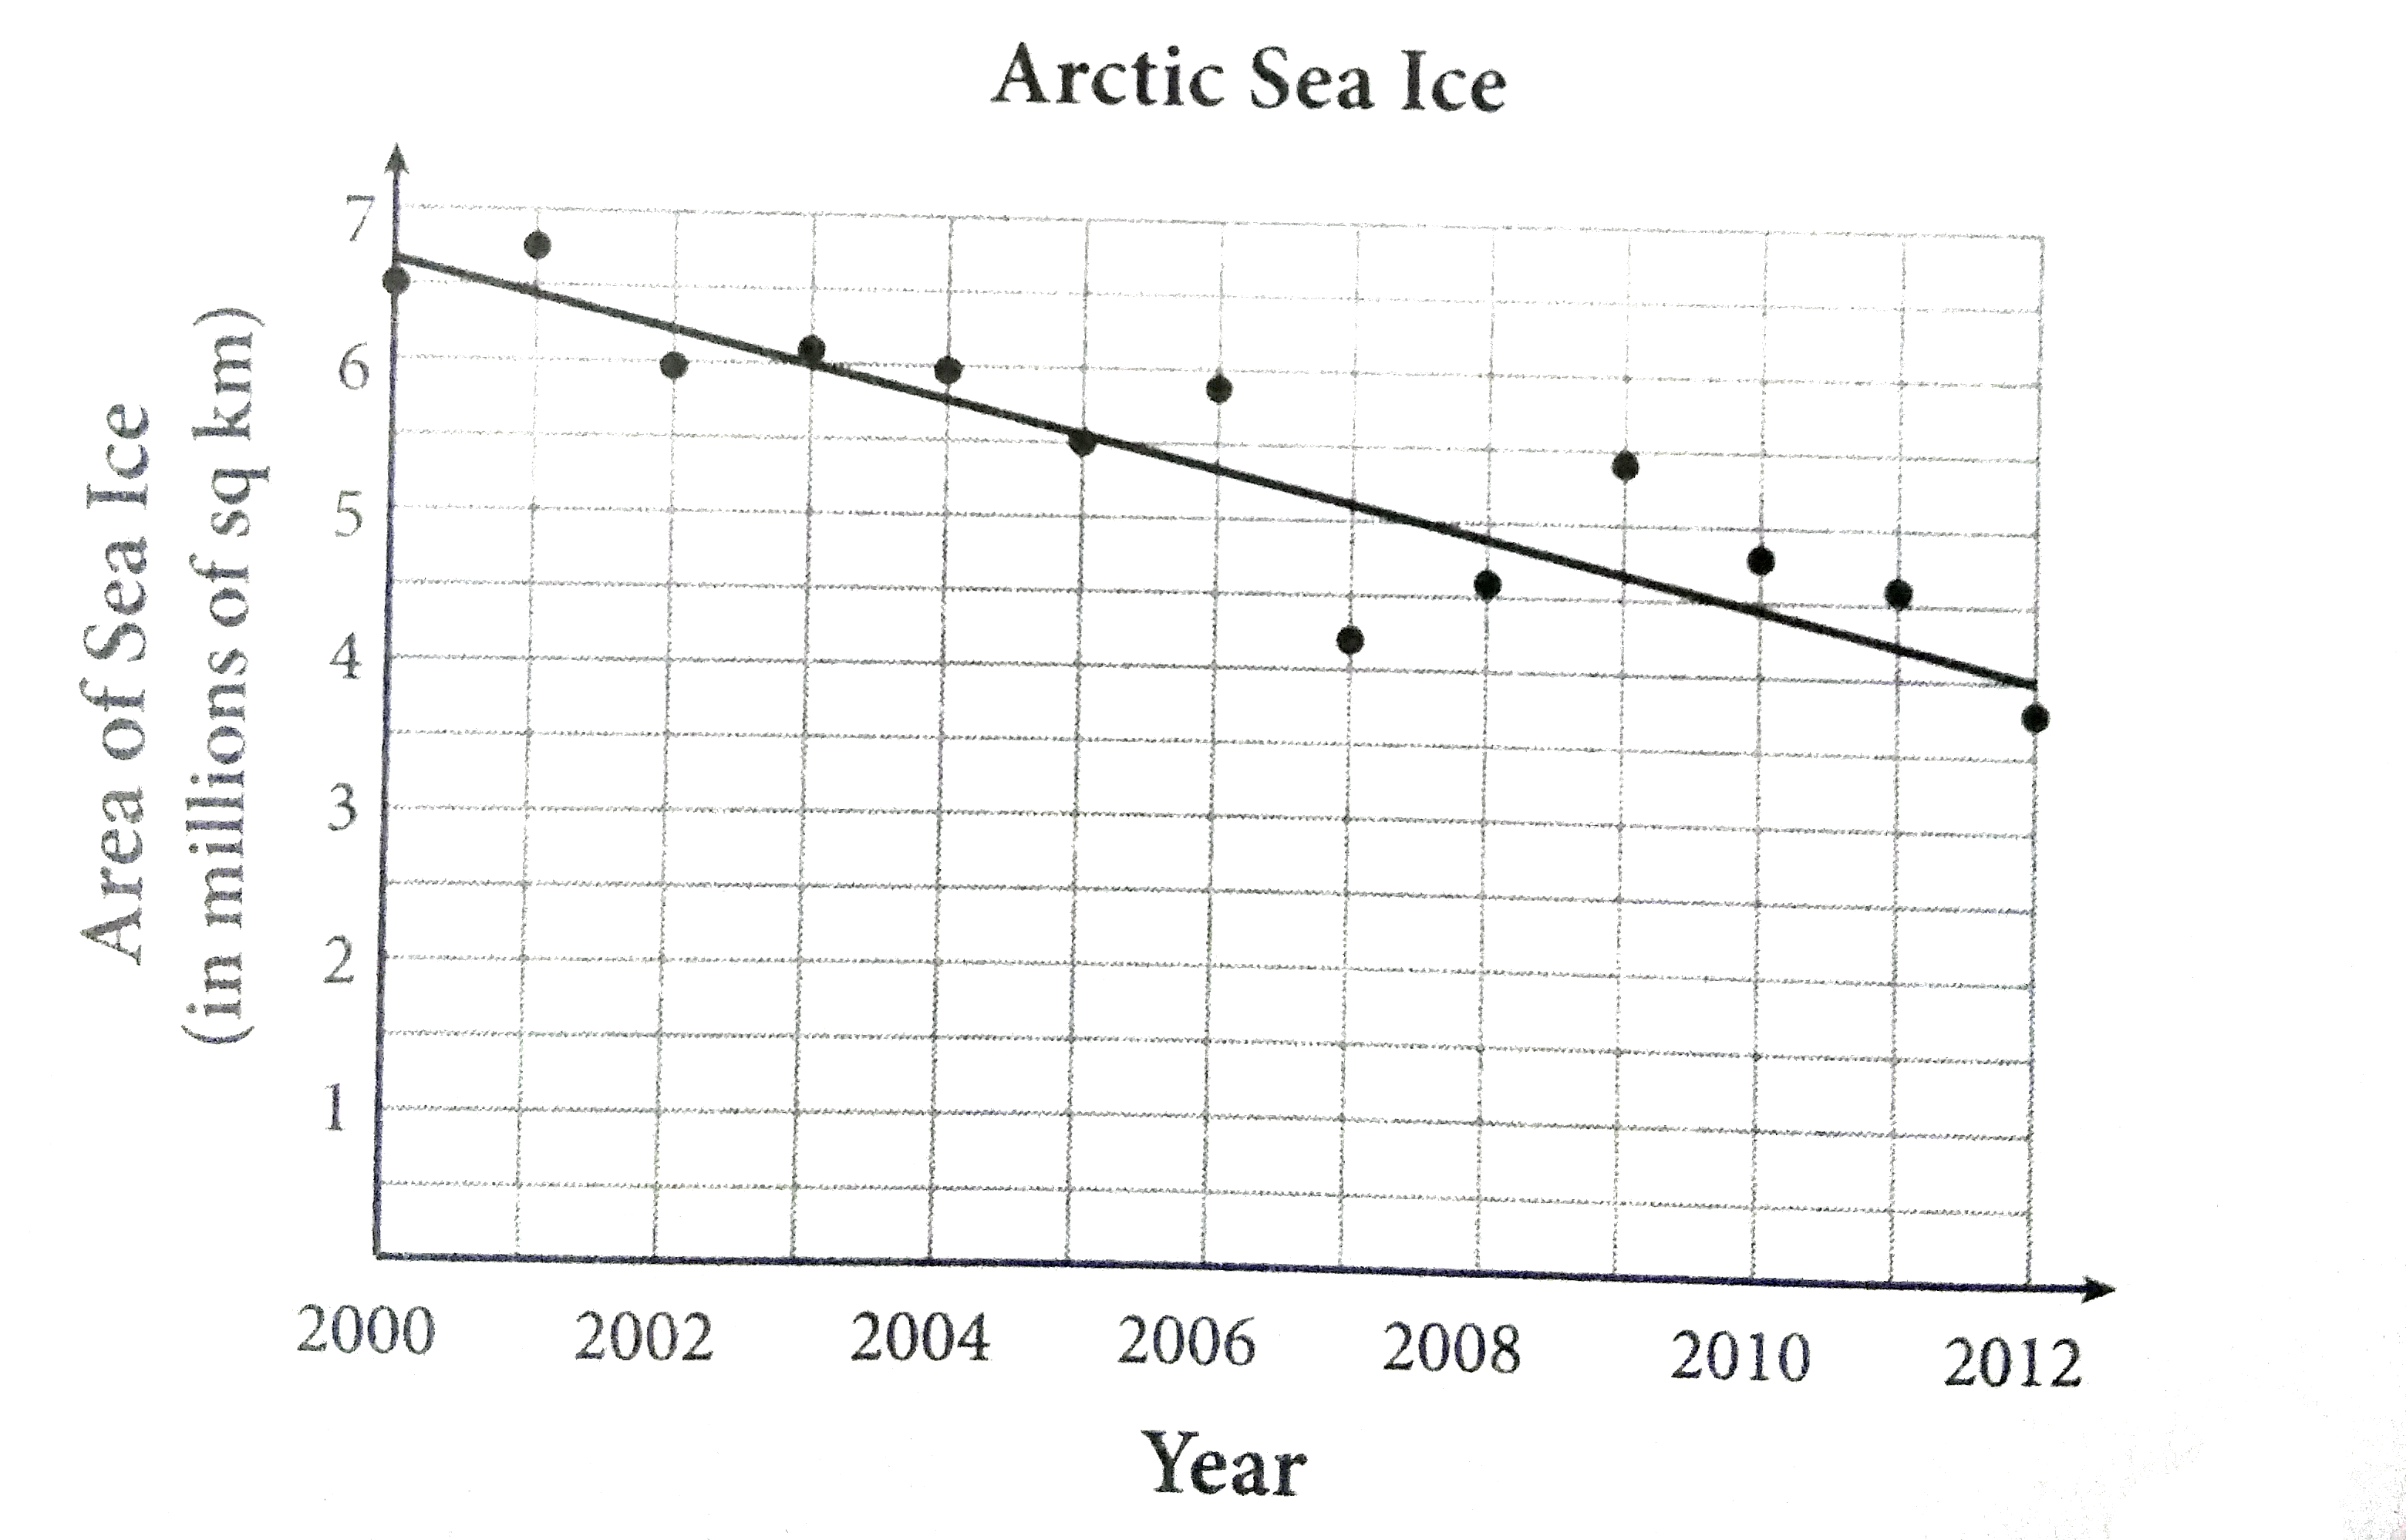
Sea ice extent is a measurement of the area of ocean with at least 15% sea ice. The graph below shows data for the extent of Artic sea ice between 2000 and 2012 as reported by the National Snow and Ice Data Center. The line of best fit is also shown. The equations of the line is A(t)=−0.187t+380.5, where A(t) represents the area of measurement sea ice in the Artic Ocean in the year t.

Q. Based on the equation of the line of best fit, which of the following statements accurately of measurable Arctic sea ice during the given times period?
The amount of sea ice increased approximately 187,000 square kilometers per year.
The amount of sea ice increased approximately 187 million square kilometers per year.
The amount of sea ice decreased approximately 187,000 square kilometers per year.
The amount of sea ice decreased approximately 187 million square kilometers per year.
The correct Answer is:C
Difficult: Medium
Category: Problem Solving and Data Analysis/ Scatterplots
Strategic Advice: In a real-world scenario, the slope of a line represents a unit rate. In this scenario, this unit translates as the change in the area of the sea ice per year.
Getting to the Answer: The slope of the line of best-fit is −0.187. The negative slope indicates a decrease in the amount of ice, so you can eliminate A and B. To decide between (C) and D, read the vertical axis label carefully- the amount of ice is given in milion square kilometers. This is not one of the answer choices (read D carefully), so multiply 0.187 by 1,000,000 to find that this is equivalent to a decrease of 187,000 square kilometers per year, which is (C).
Topper's Solved these Questions
Similar Questions
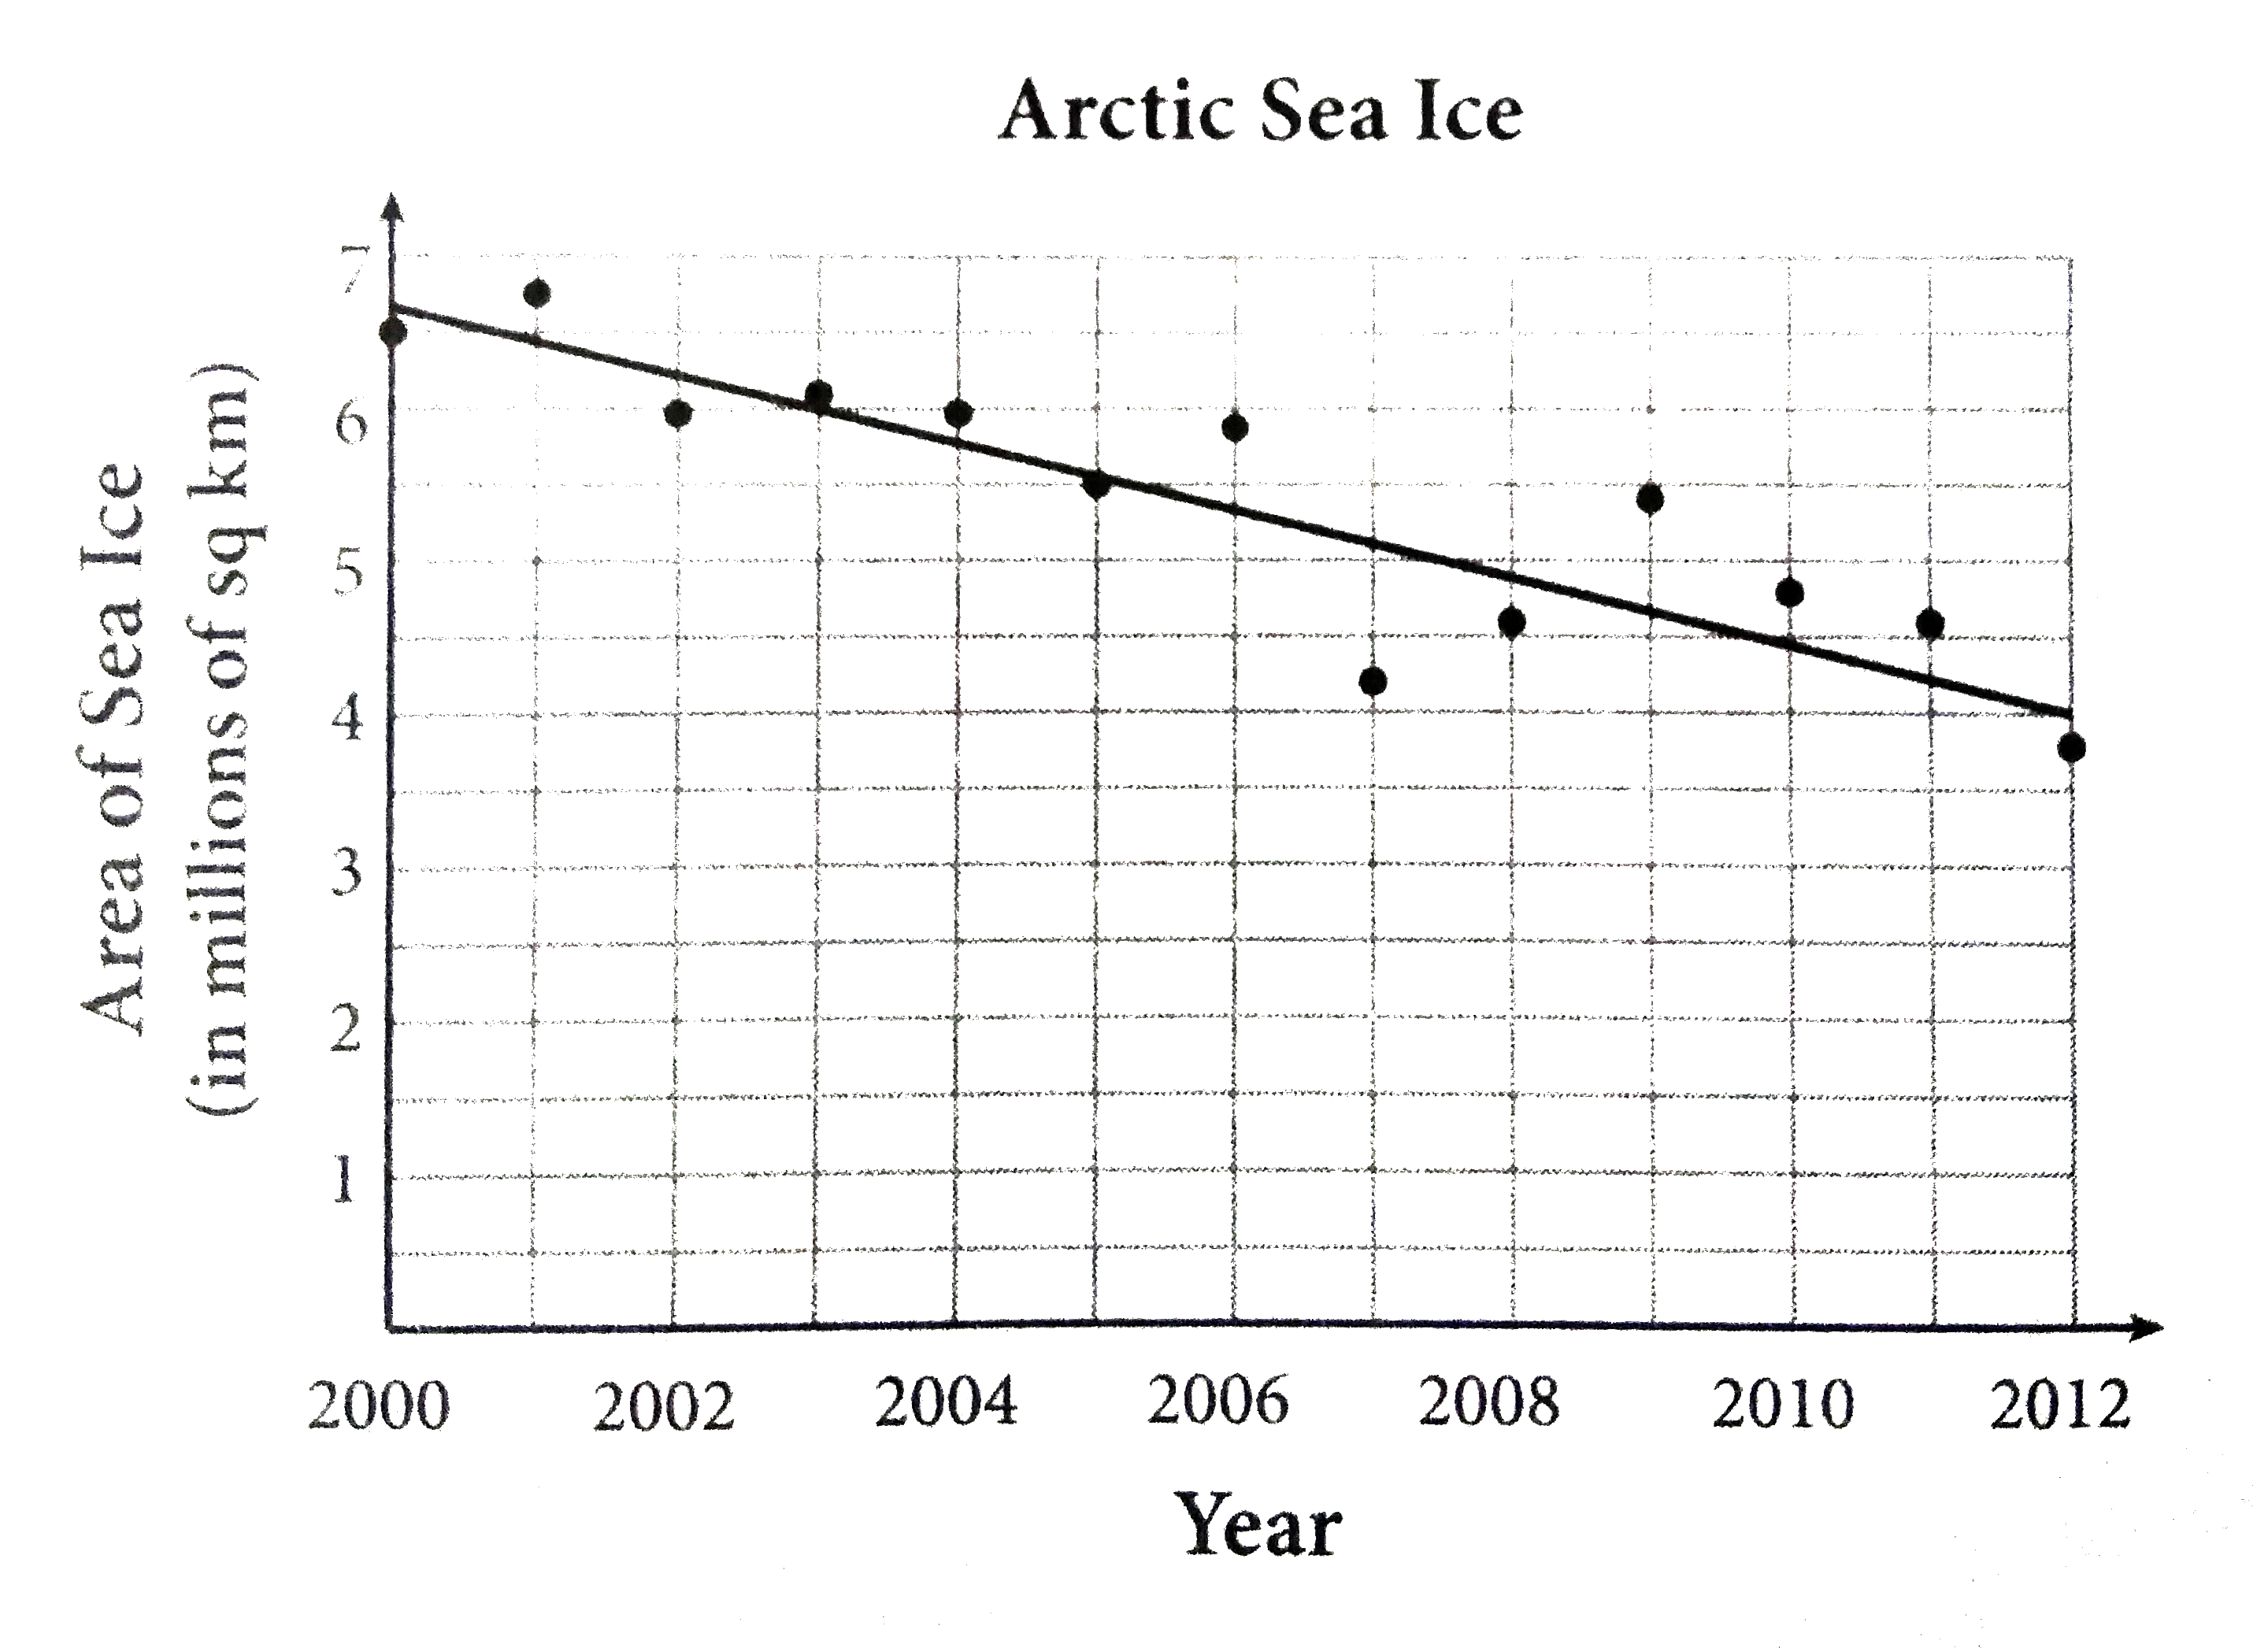
Sea ice extent is a measurement of the area of ocean with at least 15% sea ice. The graph below shows data for the extent of Artic sea ice between 2000 and 2012 as reported by the National Snow and Ice Data Center. The line of best fit is also shown. The equations of the line is A(t)=−0.187t+380.5, where A(t) represents the area of measurement sea ice in the Artic Ocean in the year t.

Q. Assuming the trand of the data continues, what is the predicted area, in millions of square kilometers, of measurable Arctic sea ice in the year 2020?View SolutionSea ice extent is a measurement of the area of ocean with at least 15% sea ice. The graph below shows data for the extent of Artic sea ice between 2000 and 2012 as reported by the National Snow and Ice Data Center. The line of best fit is also shown. The equations of the line is A(t)=−0.187t+380.5, where A(t) represents the area of measurement sea ice in the Artic Ocean in the year t.

Q. Assuming the trend of the data continues in what year will the measurable sea ice in the Arctic Ocean cease to exist?View Solution
Knowledge Check
- Question 1 - Select One
Melting of ice into water is a
Achemical changeBphysical changeCirreversible changeDperiodic change - Question 2 - Select One
The temperature of pure melting ice is :
A0∘CB100∘CC95∘CD98.6∘F

