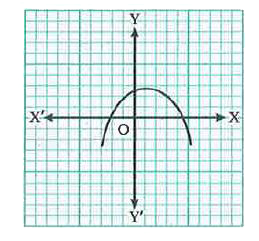
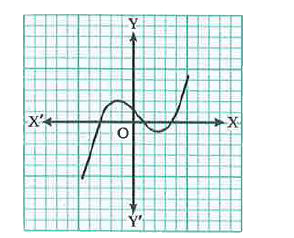
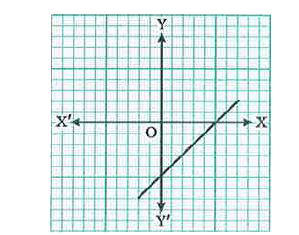
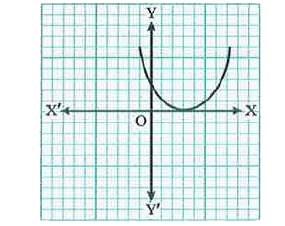
Look at the graph in the figures given below. Each is the graph of y = p(x), where p(x) is a polynomial. In each of the graphs, find the number of zeroes of p(x) in the given range of x. Solution in Telugu
Step by step video & image solution for Look at the graph in the figures given below. Each is the graph of y = p(x), where p(x) is a polynomial. In each of the graphs, find the number of zeroes of p(x) in the given range of x. by Maths experts to help you in doubts & scoring excellent marks in Class 10 exams.
Updated on:21/07/2023Topper's Solved these Questions
- POLYNOMIALSBOOK - VGS PUBLICATION-BRILLIANTCHAPTER - POLYNOMIALSEXERCISE - Do These
24 Videos
- POLYNOMIALSBOOK - VGS PUBLICATION-BRILLIANTCHAPTER - POLYNOMIALSEXERCISE - Do This
3 Videos
- PAIR OF LINEAR EQUATIONS IN TWO VARIABLESBOOK - VGS PUBLICATION-BRILLIANTCHAPTER - PAIR OF LINEAR EQUATIONS IN TWO VARIABLESEXERCISE - EXERCISE
262 Videos
- PROBABILITYBOOK - VGS PUBLICATION-BRILLIANTCHAPTER - PROBABILITYEXERCISE - EXERCISE
220 Videos
Similar Questions
State which of the following are polynomial and which are not ? Give resons.
(i) 2x3
View SolutionDraw the graph of (i) y=2x+5 and find the point of intersection on X - axis. Is the x-coordinates of these points also the zero of the polynomial?
View SolutionThe cost of 1kg potatoes and 2 kg tomatoes was Rs. 30 on a certain day. After two days, the cost of 2 kg potatoes and 4 kg tomatoes was found to be Rs. 66.Identify the unknowns in each situation. We observe that there are two unknowns in each case.
View SolutionOutcomes of which of the following experiments are equally likely ?(1)Getting a digit 1, 2, 3, 4, 5 or 6 when a dice is rolled.(2)Selecting a different colour ball from a bag of 5 red balls, 4 blue balls and 1 blackball.Winning in a game of carrom.(3) Units place of a two digit number selected may be 0, 1, 2, 3, 4, 5, 6, 7, 8 or 9.(4) Selecting a different colour ball from a bag of 10 red balls, 10 blue balls and 10 black balls.(5) Raining on a particular day of July.Are the outcomes of every experiment equally likely?
View SolutionLook at the graphs in Figure given below. Each is the graph of y=p(x), where p(x) is a polynomial. For each of the graphs, find the number of zeroes of p(x).
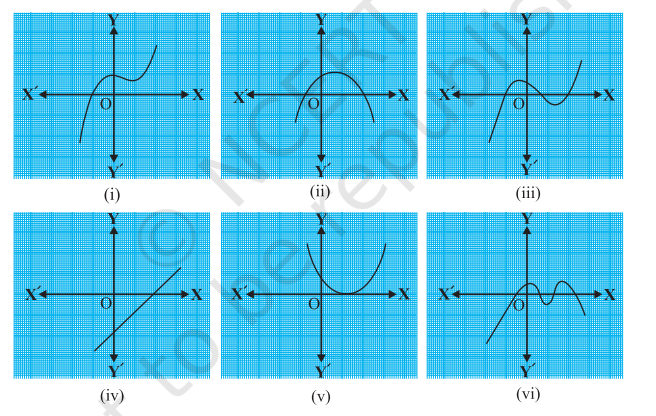
View Solutionनीचे दी गई आकृति 2.9 में , ग्राफों को देखिए । प्रत्येक आकृति y=p(x) जहाँ p(x) एक बहुपद है , का ग्राफ है । ग्राफ है । ग्राफों से प्रत्येक के लिए p(x) के शून्यको की संख्या ज्ञात कीजिए ।

View SolutionLook at graphs in the figures below. Each is the graph of y=p(x), where p(x) is a polynomial. In each of the graphs, find the number of zeroes of p(x) in the given range of x .
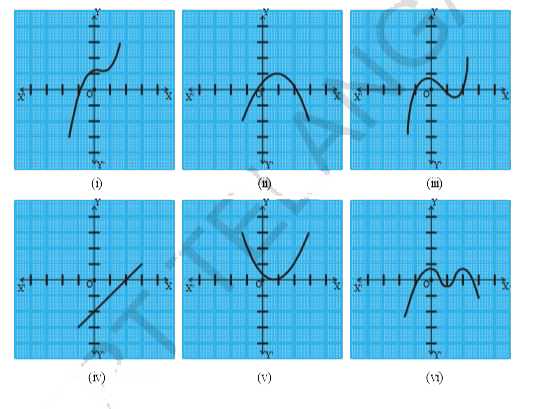
View Solutionx3−2x+5 find coefficient of x2,x1,x0.
View SolutionLook at graphs in the figures below. Each is the graph of y=p(x), where p(x) is a polynomial. In each of the graphs, find the number of zeroes of p(x) in the given range of x .
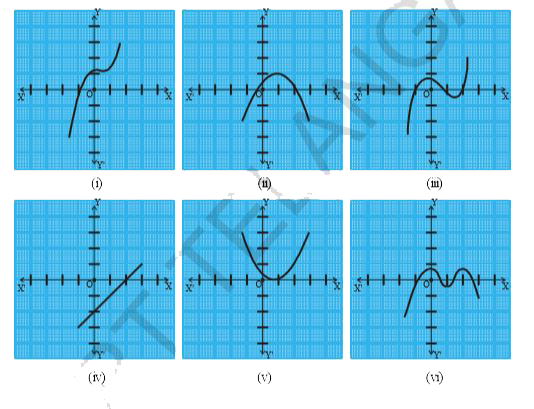
View SolutionLook at the graphs in Figure given below. Each is the graph of y=p(x), where p(x) is a polynomial. For each of the graphs, find the number of zeroes of p(x).
View SolutionLook at the graphs in the figures given below. Each is the graph of y=p(x), where p(x) is a polynomial. For each of the graphs, find the number of zeroes of p(x).
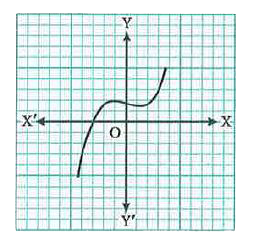
View SolutionLook at the graphs in the figures given below. Each is the graph of y=p(x), where p(x) is a polynomial. For each of the graphs, find the number of zeroes of p(x).
View SolutionLook at the graphs in the figures given below. Each is the graph of y=p(x), where p(x) is a polynomial. For each of the graphs, find the number of zeroes of p(x).
View SolutionLook at the graphs in the figures given below. Each is the graph of y=p(x), where p(x) is a polynomial. For each of the graphs, find the number of zeroes of p(x).
View SolutionLook at the graphs in the figures given below. Each is the graph of y=p(x), where p(x) is a polynomial. For each of the graphs, find the number of zeroes of p(x).
View Solution
