Number of children in six different classes are given below. Represent the data on a bar graph.(a) How would you choose a scale.(b) Answer the following questions:(i) Which class has the maximum number of children? And the minimum?(ii) Find the ratio of students of class sixth to the students of class eight.
a)
Scale on y -axis is 1 unit children
b)
(i) Fifth class has maximum number of children i.e.
Tenth class has the minimum number of children i.e.
(ii)Number of students in class sixth
Number of students in class eighth =
(iii)
Ratio=(Number of students in class sixth)/(Number of students in class eighth)
Topper's Solved these Questions
- DATA HANDLINGBOOK - NCERT ENGLISHCHAPTER - DATA HANDLINGEXERCISE - EXERCISE 3.1
8 Videos
- DATA HANDLINGBOOK - NCERT ENGLISHCHAPTER - DATA HANDLINGEXERCISE - EXERCISE 3.2
5 Videos
- DATA HANDLINGBOOK - NCERT ENGLISHCHAPTER - DATA HANDLINGEXERCISE - EXERCISE 3.4
4 Videos
- CONGRUENCE OF TRIANGLESBOOK - NCERT ENGLISHCHAPTER - CONGRUENCE OF TRIANGLESEXERCISE - SOLVED EXAMPLES
9 Videos
- EXPONENTS AND POWERSBOOK - NCERT ENGLISHCHAPTER - EXPONENTS AND POWERSEXERCISE - EXERCISE 13.2
5 Videos
Similar Questions
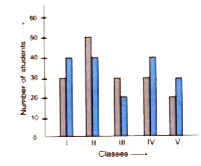
Exmine the given graph carefully.

In the graph show above represents the number of girls in a particular class and represents the number of boys in the same class.
Read and answer the following questions.
(i) Which class has the least number of students ?
(ii) Which class has maximum number of students ?
(iii) What is the ratio between the number of girls and the number of boys of class V.
View SolutionThe number of girl students in each class of a co-educational middle school is depicted by the pictograph Observe this pictograph and answer the following questions :(a) Which class has the minimum number of girl students?(b) Is the number of girls in Class VI less than the number of girls in Class V?(c) How many girls are there in Class VII?
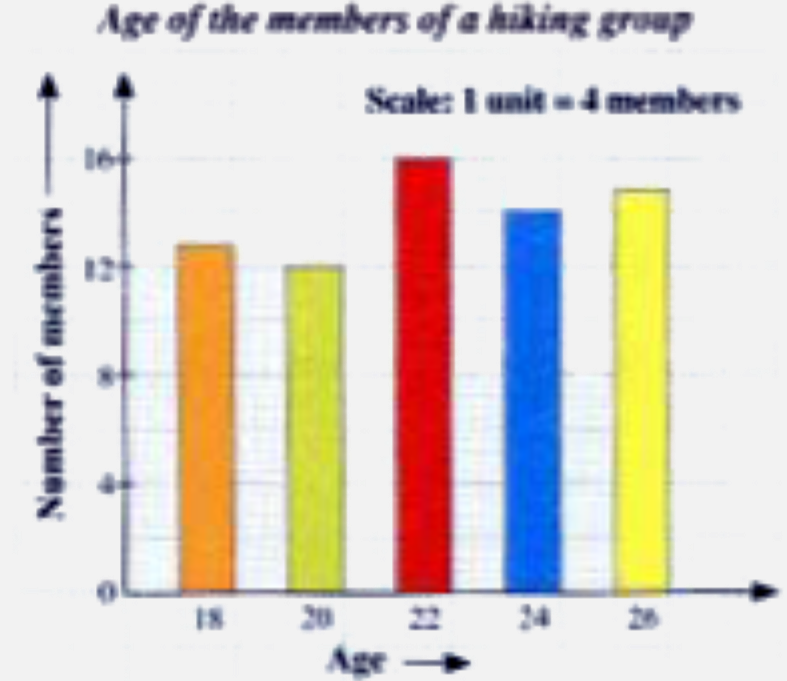
View SolutionThe given graph represents the age and number of members of a hiking group who are planning an excursion. Study the graph and answer the following question.
Which age group has the maximum members in the hiking gruoup?

View SolutionThe number of girl students in each class of co-ed. Middle school is depicted by the following pictograph: Class, No. of girls, = 4 girls I, Figure, II, Figure, III, Figure, IV, Figure, V, Figure, VI, Figure, VII, Figure, VIII, Figure, Observe the above pictograph and answer the following questions: Which class has the maximum number of girl students? Is the number of girls in class VI is less than the number of girls in class V? How many girls are there in VII class?
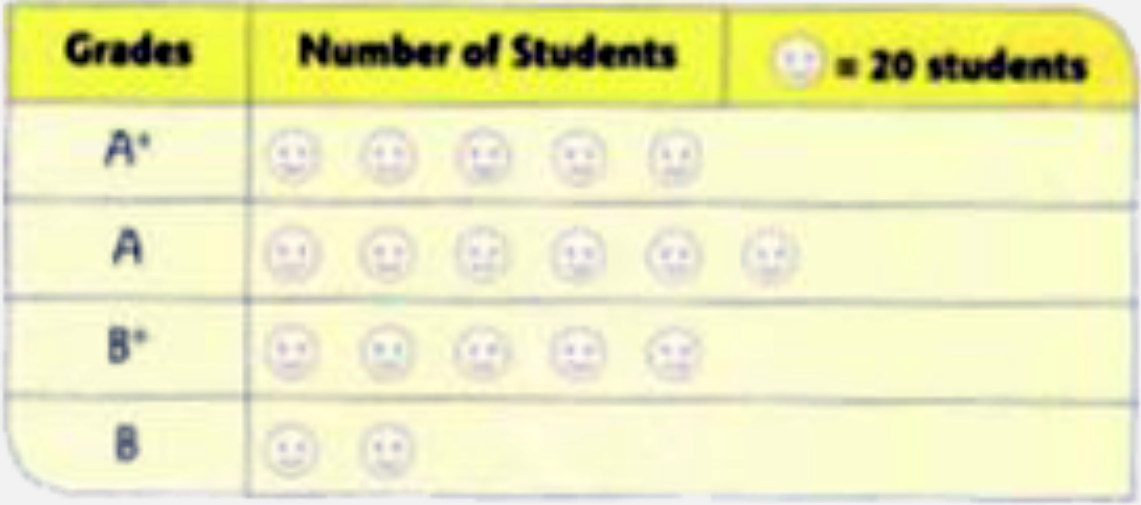
View SolutionA testing centre conducted a 'Spelling Test' for class VI students. The following pictograph represents the results of the test.

Answer the following:
Which grade was received by the maximum number of students?
View SolutionThe following bar graph represents the data for different sizes of shoes worn by the students in a school. Read the graph and answer the following questions.
(i)What are the different numbers of the shoe-worn by the students?
(ii)What is the number of students wearing shoe No. 6?
(iii)Which shoe number is worn by the maximum number of students?
(iv)Which shoe number is worn by the minimum number of students?
View SolutionDraw a histogram for the frequency table made for the data in Question 3, and answer the following questions.(i) Which group has the maximum number of workers?(ii) How many workers earn Rs 850 and more?(iii) How many workers earn less than Rs 850?
View SolutionThe following bar graph shows the number of vehicles passing through a road crossing in Delhi in different time intervals on a particular day. Read the bar graph and answer the following questions: What does the bar graph represent? Also, give the maximum number of vehicles. When is the hourly traffic maximum? Also give the minimum number of vehicles. When is the hourly traffic minimum? What is the total number of vehicles passing through a crossing during a particular day?
View SolutionA class teacher has the following absentee record of 40 students of a class for the whole term. Find the mean number of days a student was absent.
View SolutionThe following bar graph (Figure) represents the heights (in cm) of 50 students of Class XI of a particular school. Study the graph and answer the following questions: What percentage of the total number of students have their heights more than 149 cm? How many students in the class are in the range of maximum height of the class? The school wants to provide a particular type of tonic to each student below the height of 150cm to improve his height. If the cost of the tonic for each student comes out to be Rs. 55, how much amount of money is required? How many students are in the range of shortest height of the class? State whether true or false: There are 9 students in the class whose heights are in the range of 155-159 cm. Maximum height (in cm) of a student in the class is 17. There are 29 students in the class whose heights are in the range of 145-154 cm. Minimum height (in cm) of a student is the class is in the range of 140-144cms. The number of students in the class having their heights less than 150cm is 12. There are 14 students each of whom has height more than 154 cm.
View Solution
