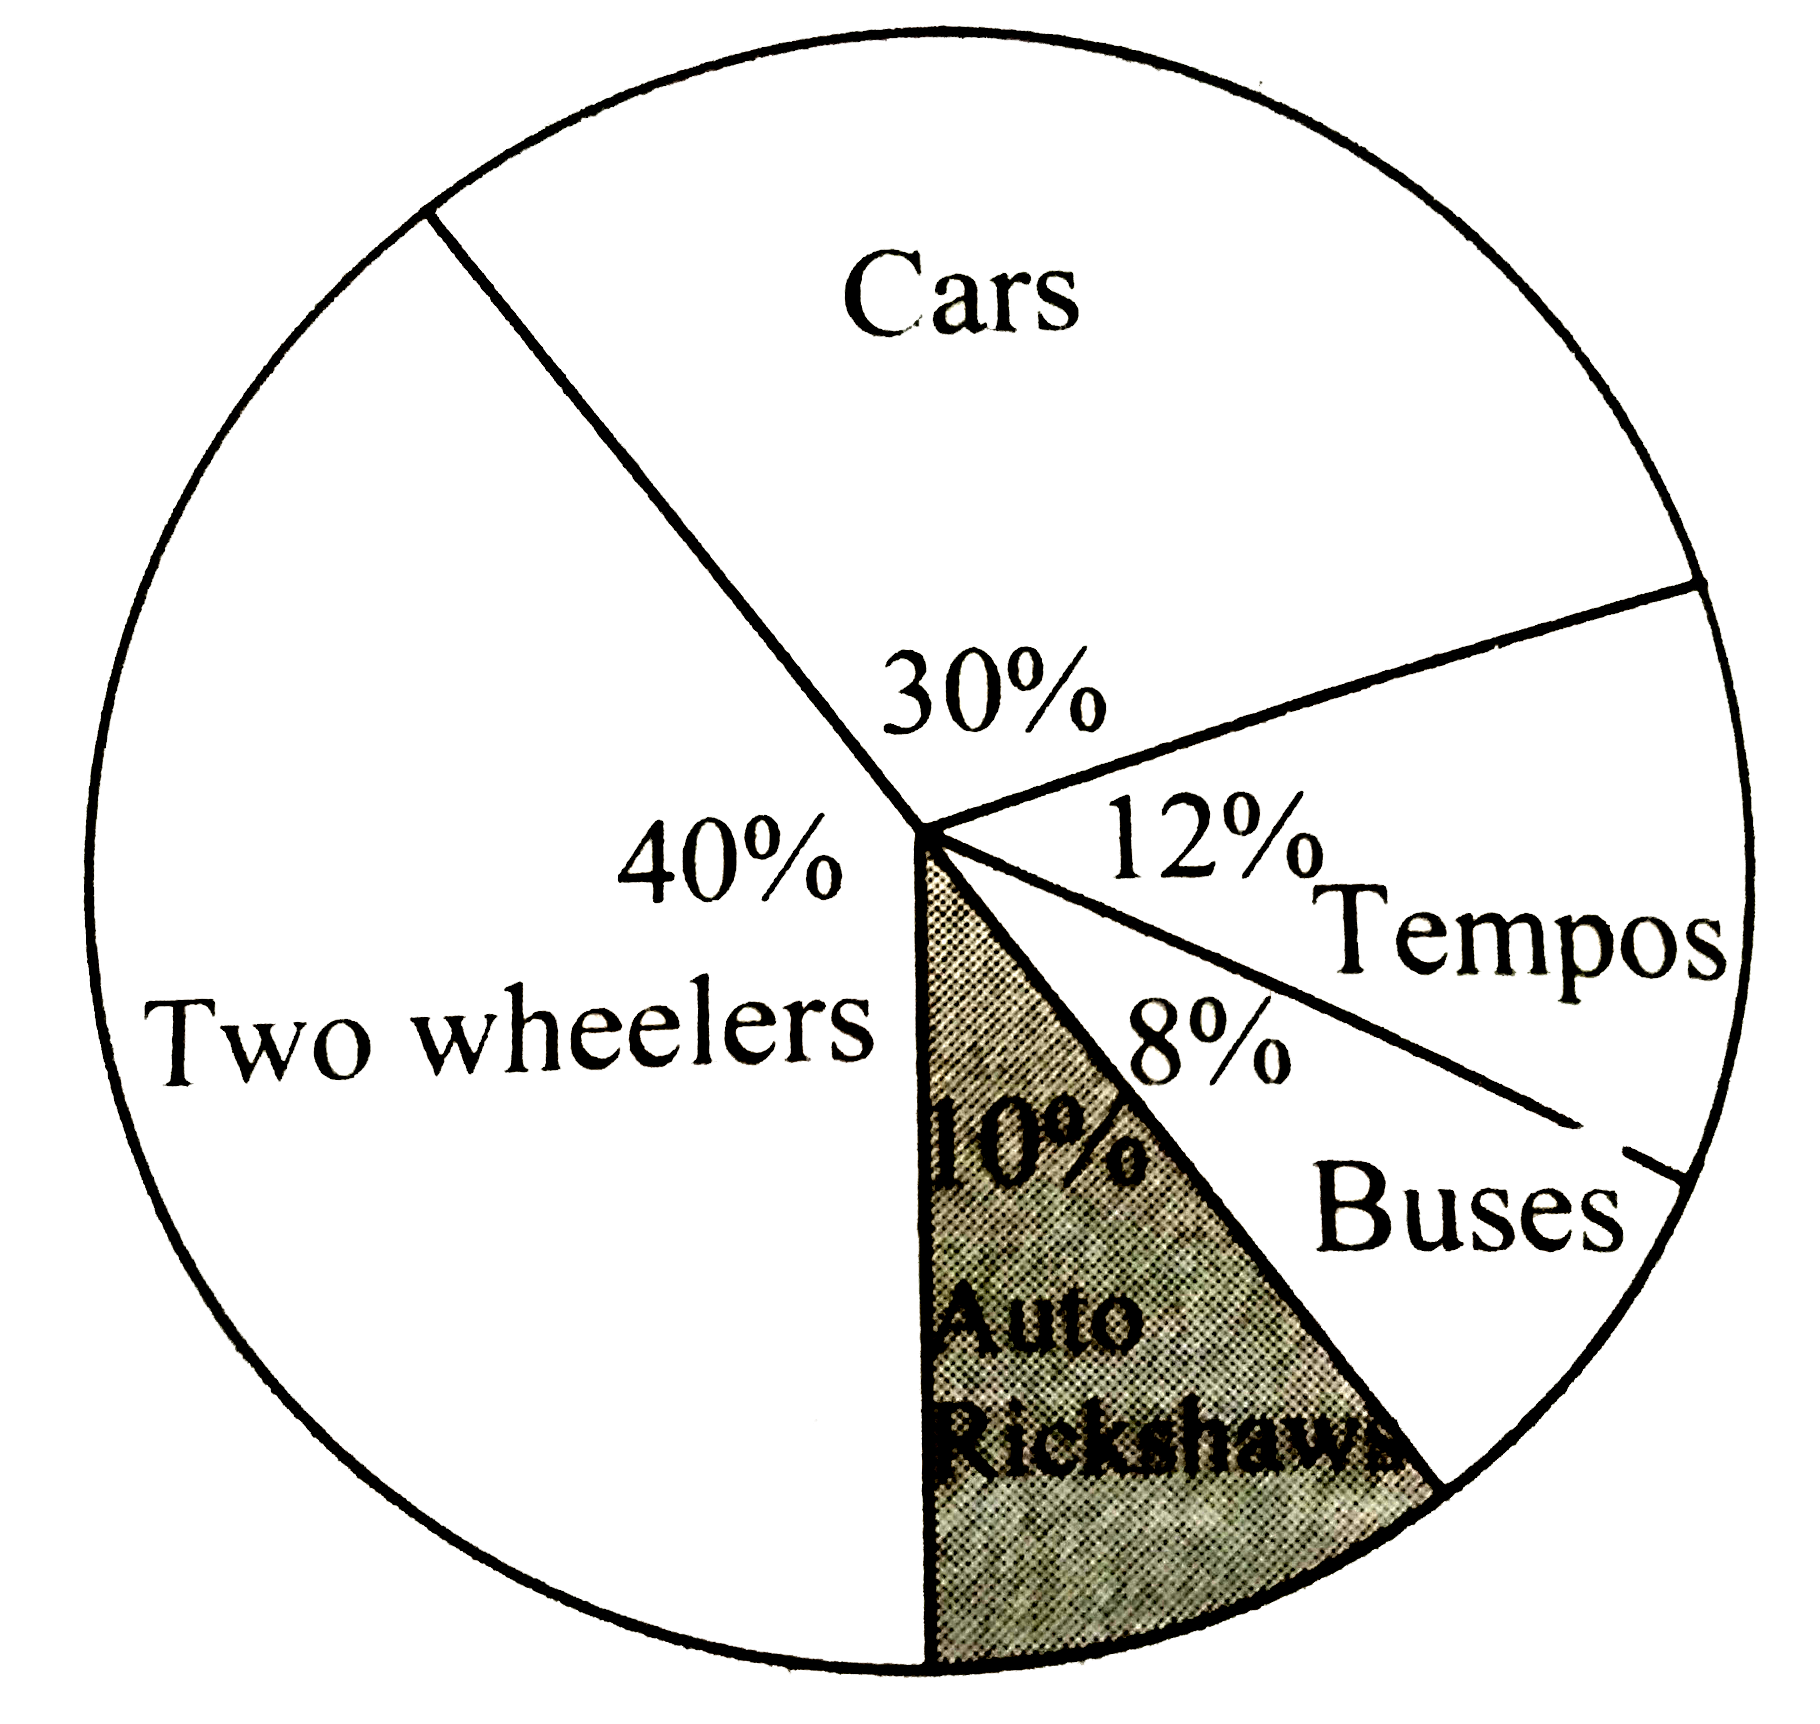
Observe the given pie diagram. It shows the percentages of number of vehicles passing a signal in a town between 8am and 10 am.
i. Find the central angle for each type of vehicle.
ii. If the number of two-wheelers is 1200, find the number of all vehicles.
The correct Answer is:3000
Step by step video & image solution for Observe the given pie diagram. It shows the percentages of number of vehicles passing a signal in a town between 8am and 10 am. i. Find the central angle for each type of vehicle. ii. If the number of two-wheelers is 1200, find the number of all vehicles. by Maths experts to help you in doubts & scoring excellent marks in Class 10 exams.
Updated on:21/07/2023Topper's Solved these Questions
Similar Questions
Observe the pie diagram given below .It shows the percentages of number of vehicles passing a signal in a town between 8 am and 10 am.
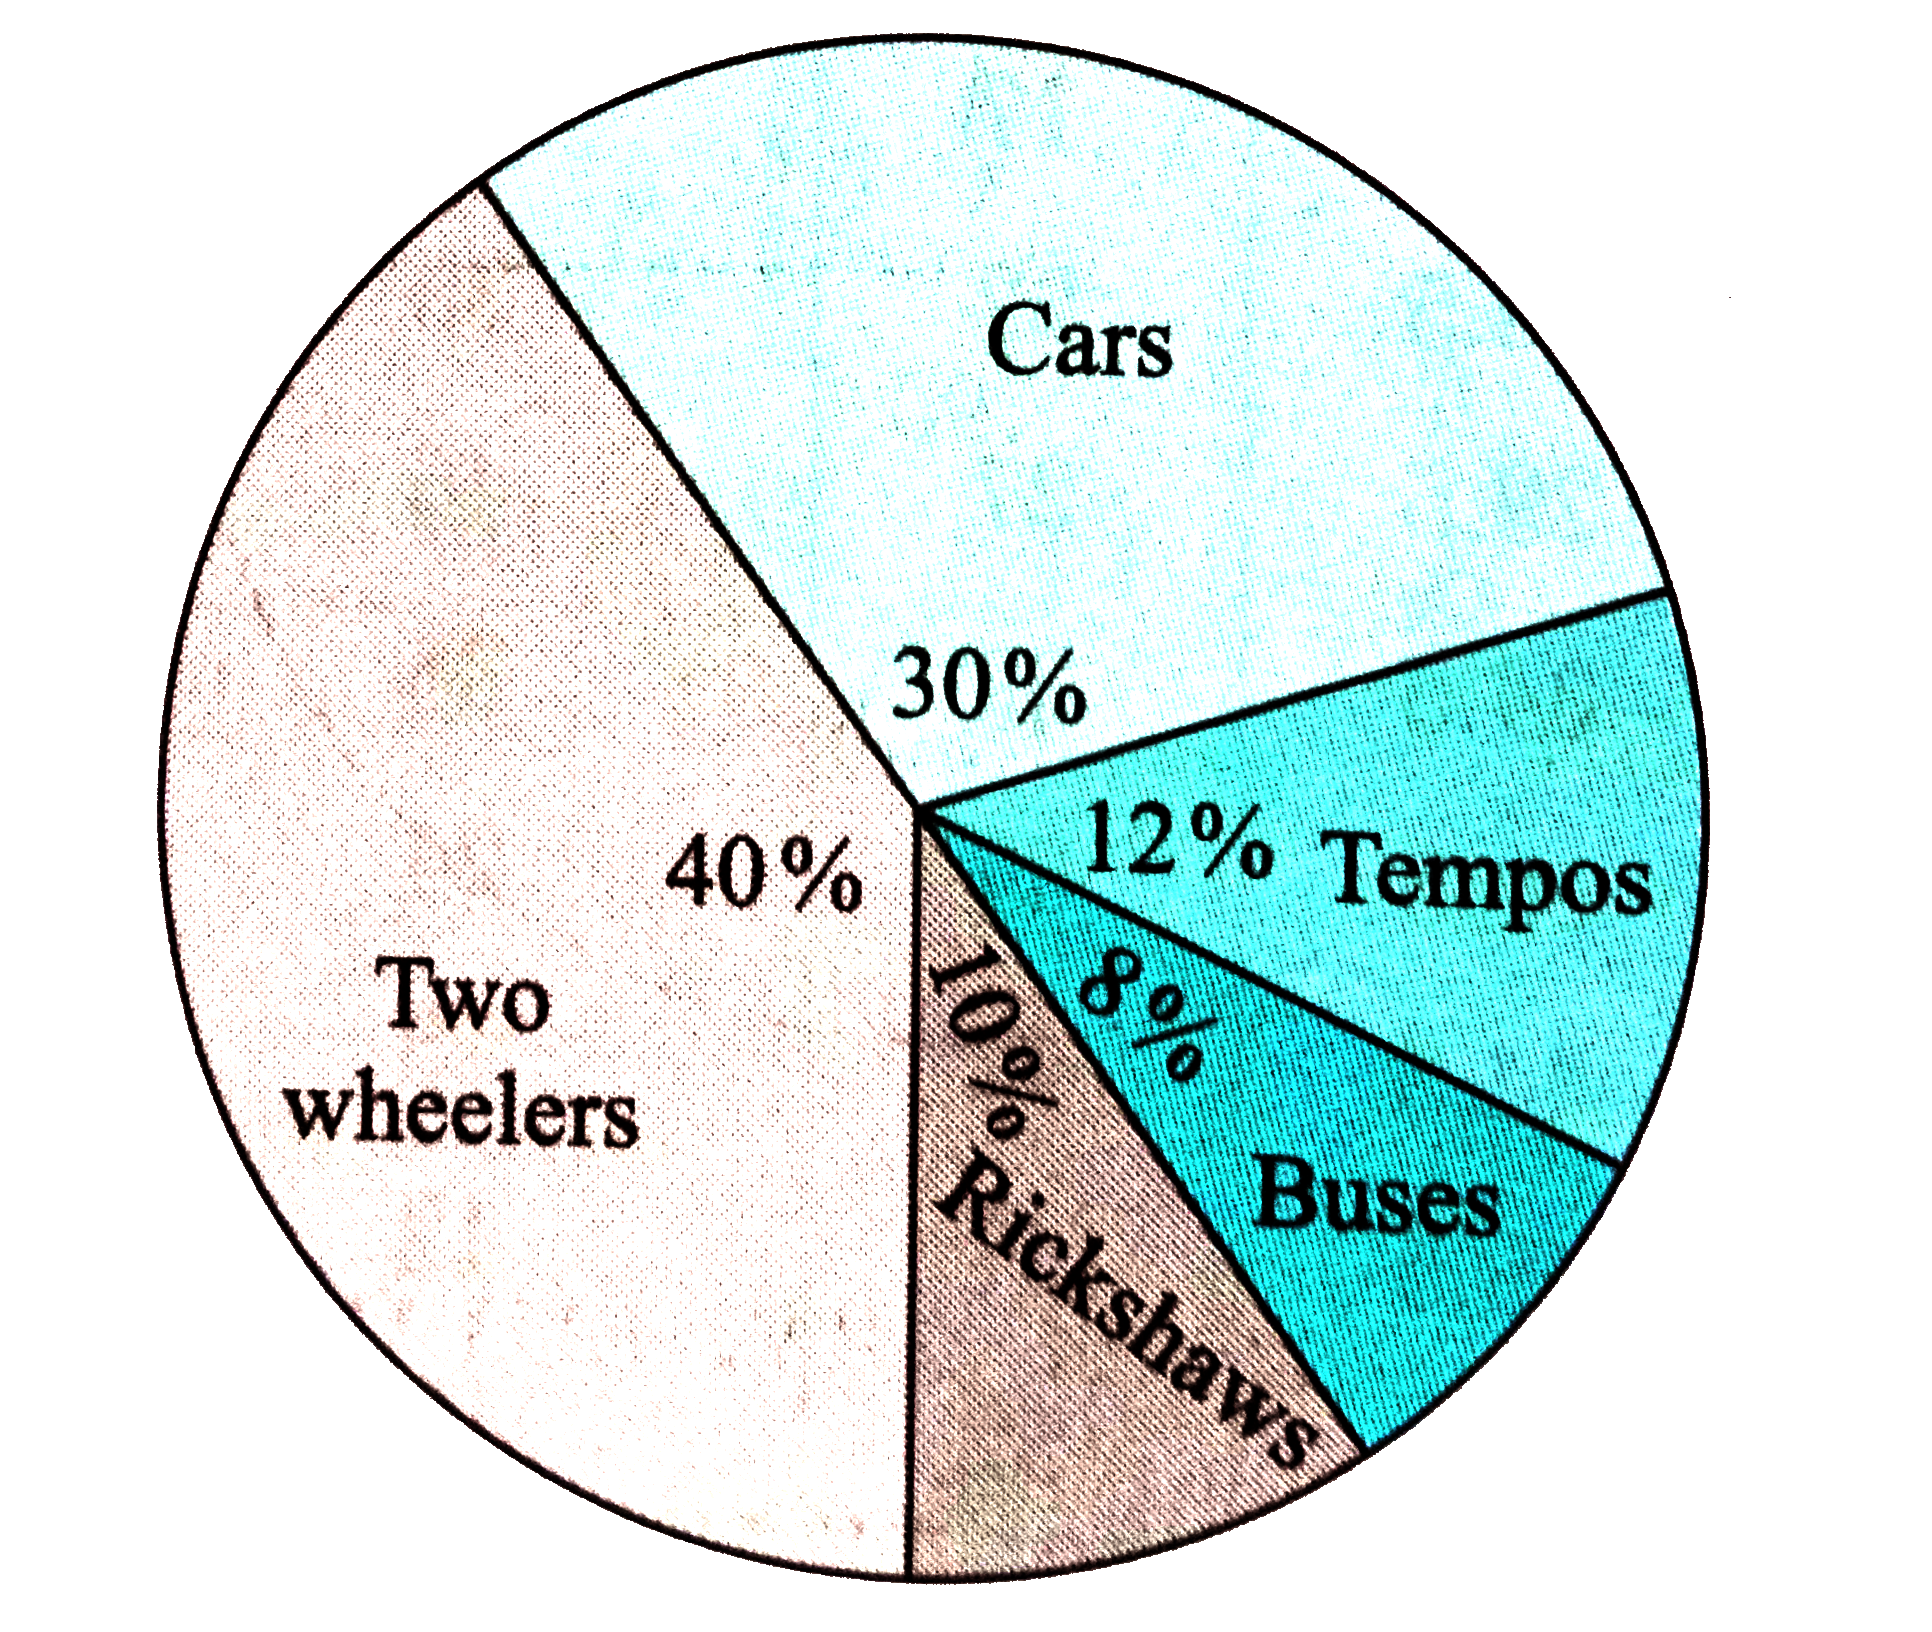
Find the central angle for each type of vehicle.
View SolutionObserve the pie diagram given below .It shows the percentages of number of vehicles passing a signal in a town between 8 am and 10 am.
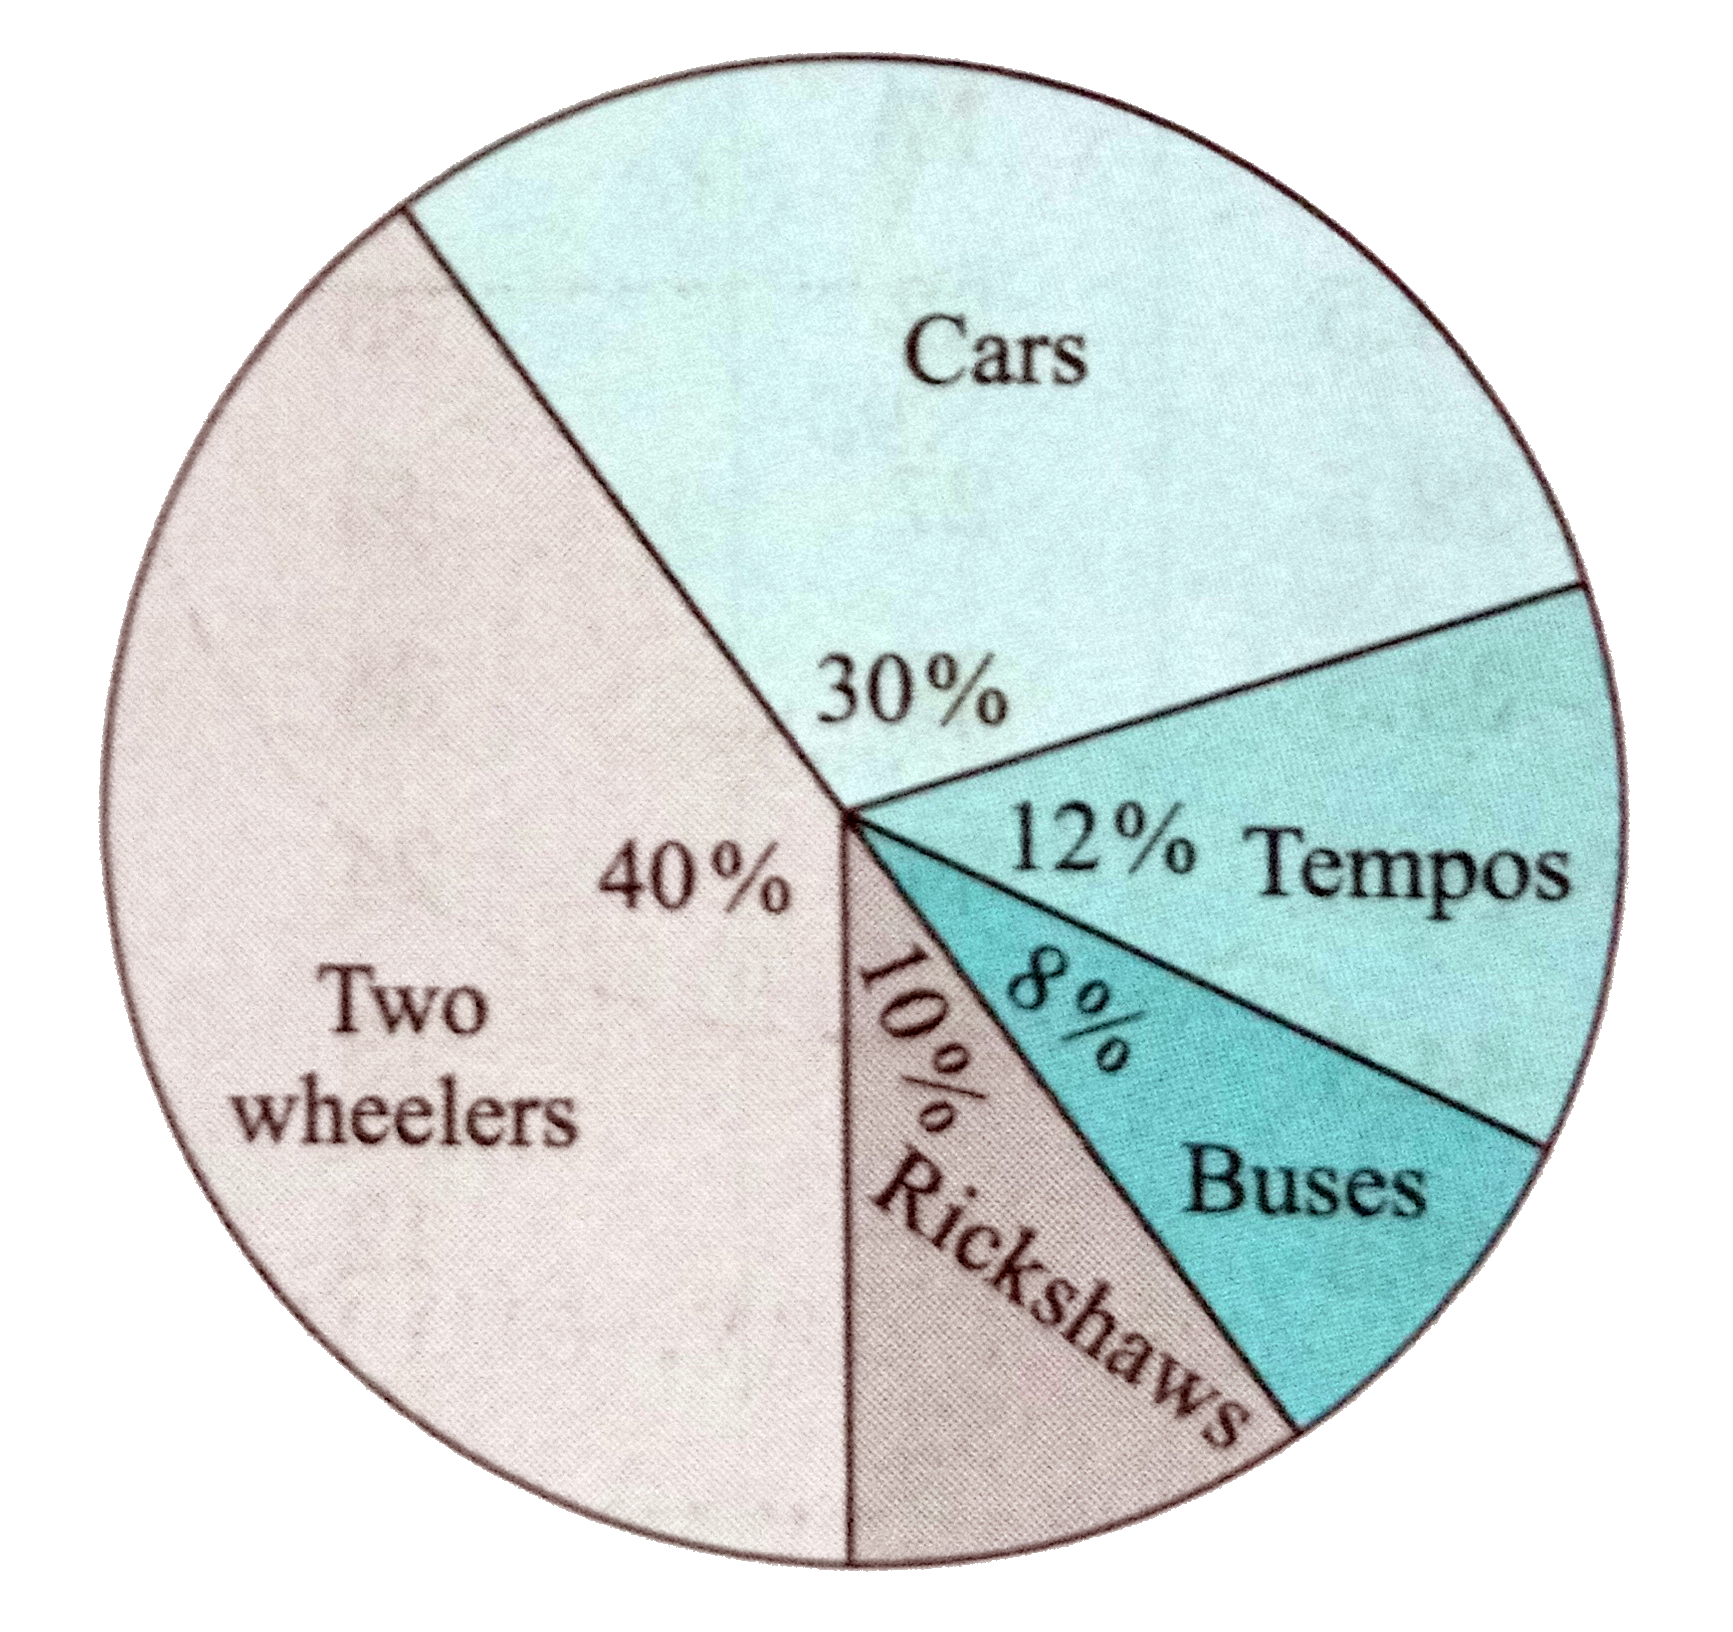
If the number of two - wheelers is 1200, find the number of all vehicles.
View Solution
Knowledge Check
The A.M of two numbers is 17 and their G.M. is 8. Find the numbers.
A2, 32B4, 30C10, 24DNone of theseThe given pie chart shows the percentage distribution of 450 employees in an organisation. Study the pie chart and answer the question that follows
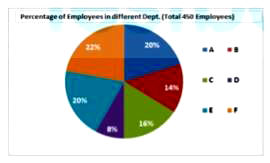
What is the central angle of the sector representing the number of employees in department A ?A72∘B108∘C90∘D36∘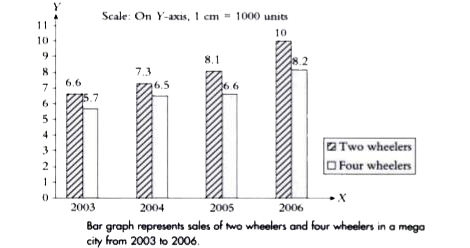
Find the ratio between number of vehicles sold in the year 2004 and in the year 2006.A41:46B69:91C147:182D46:49
The following table shows the percentage of vehicles passing a signal. Find out the measures of the central angles to show the information by a pie diagram. Hence draw the pie diagram.

View SolutionThe A.M. between two numbers is 20 and their G.M. is 16. find the numbers.
View SolutionThe following table shows the classification of number of vehicles and their speeds on Mumbai-Pune express way. Find the median of the data.

View SolutionThe following table shows the classification of number of vehicles and their speeds on Mumbai-pune express way.Find the median of the data.

View SolutionThe following table shows the classification of number of vehicles and their speeds on Mumbai - Pune expressway. Find the median of the data .

View Solution
