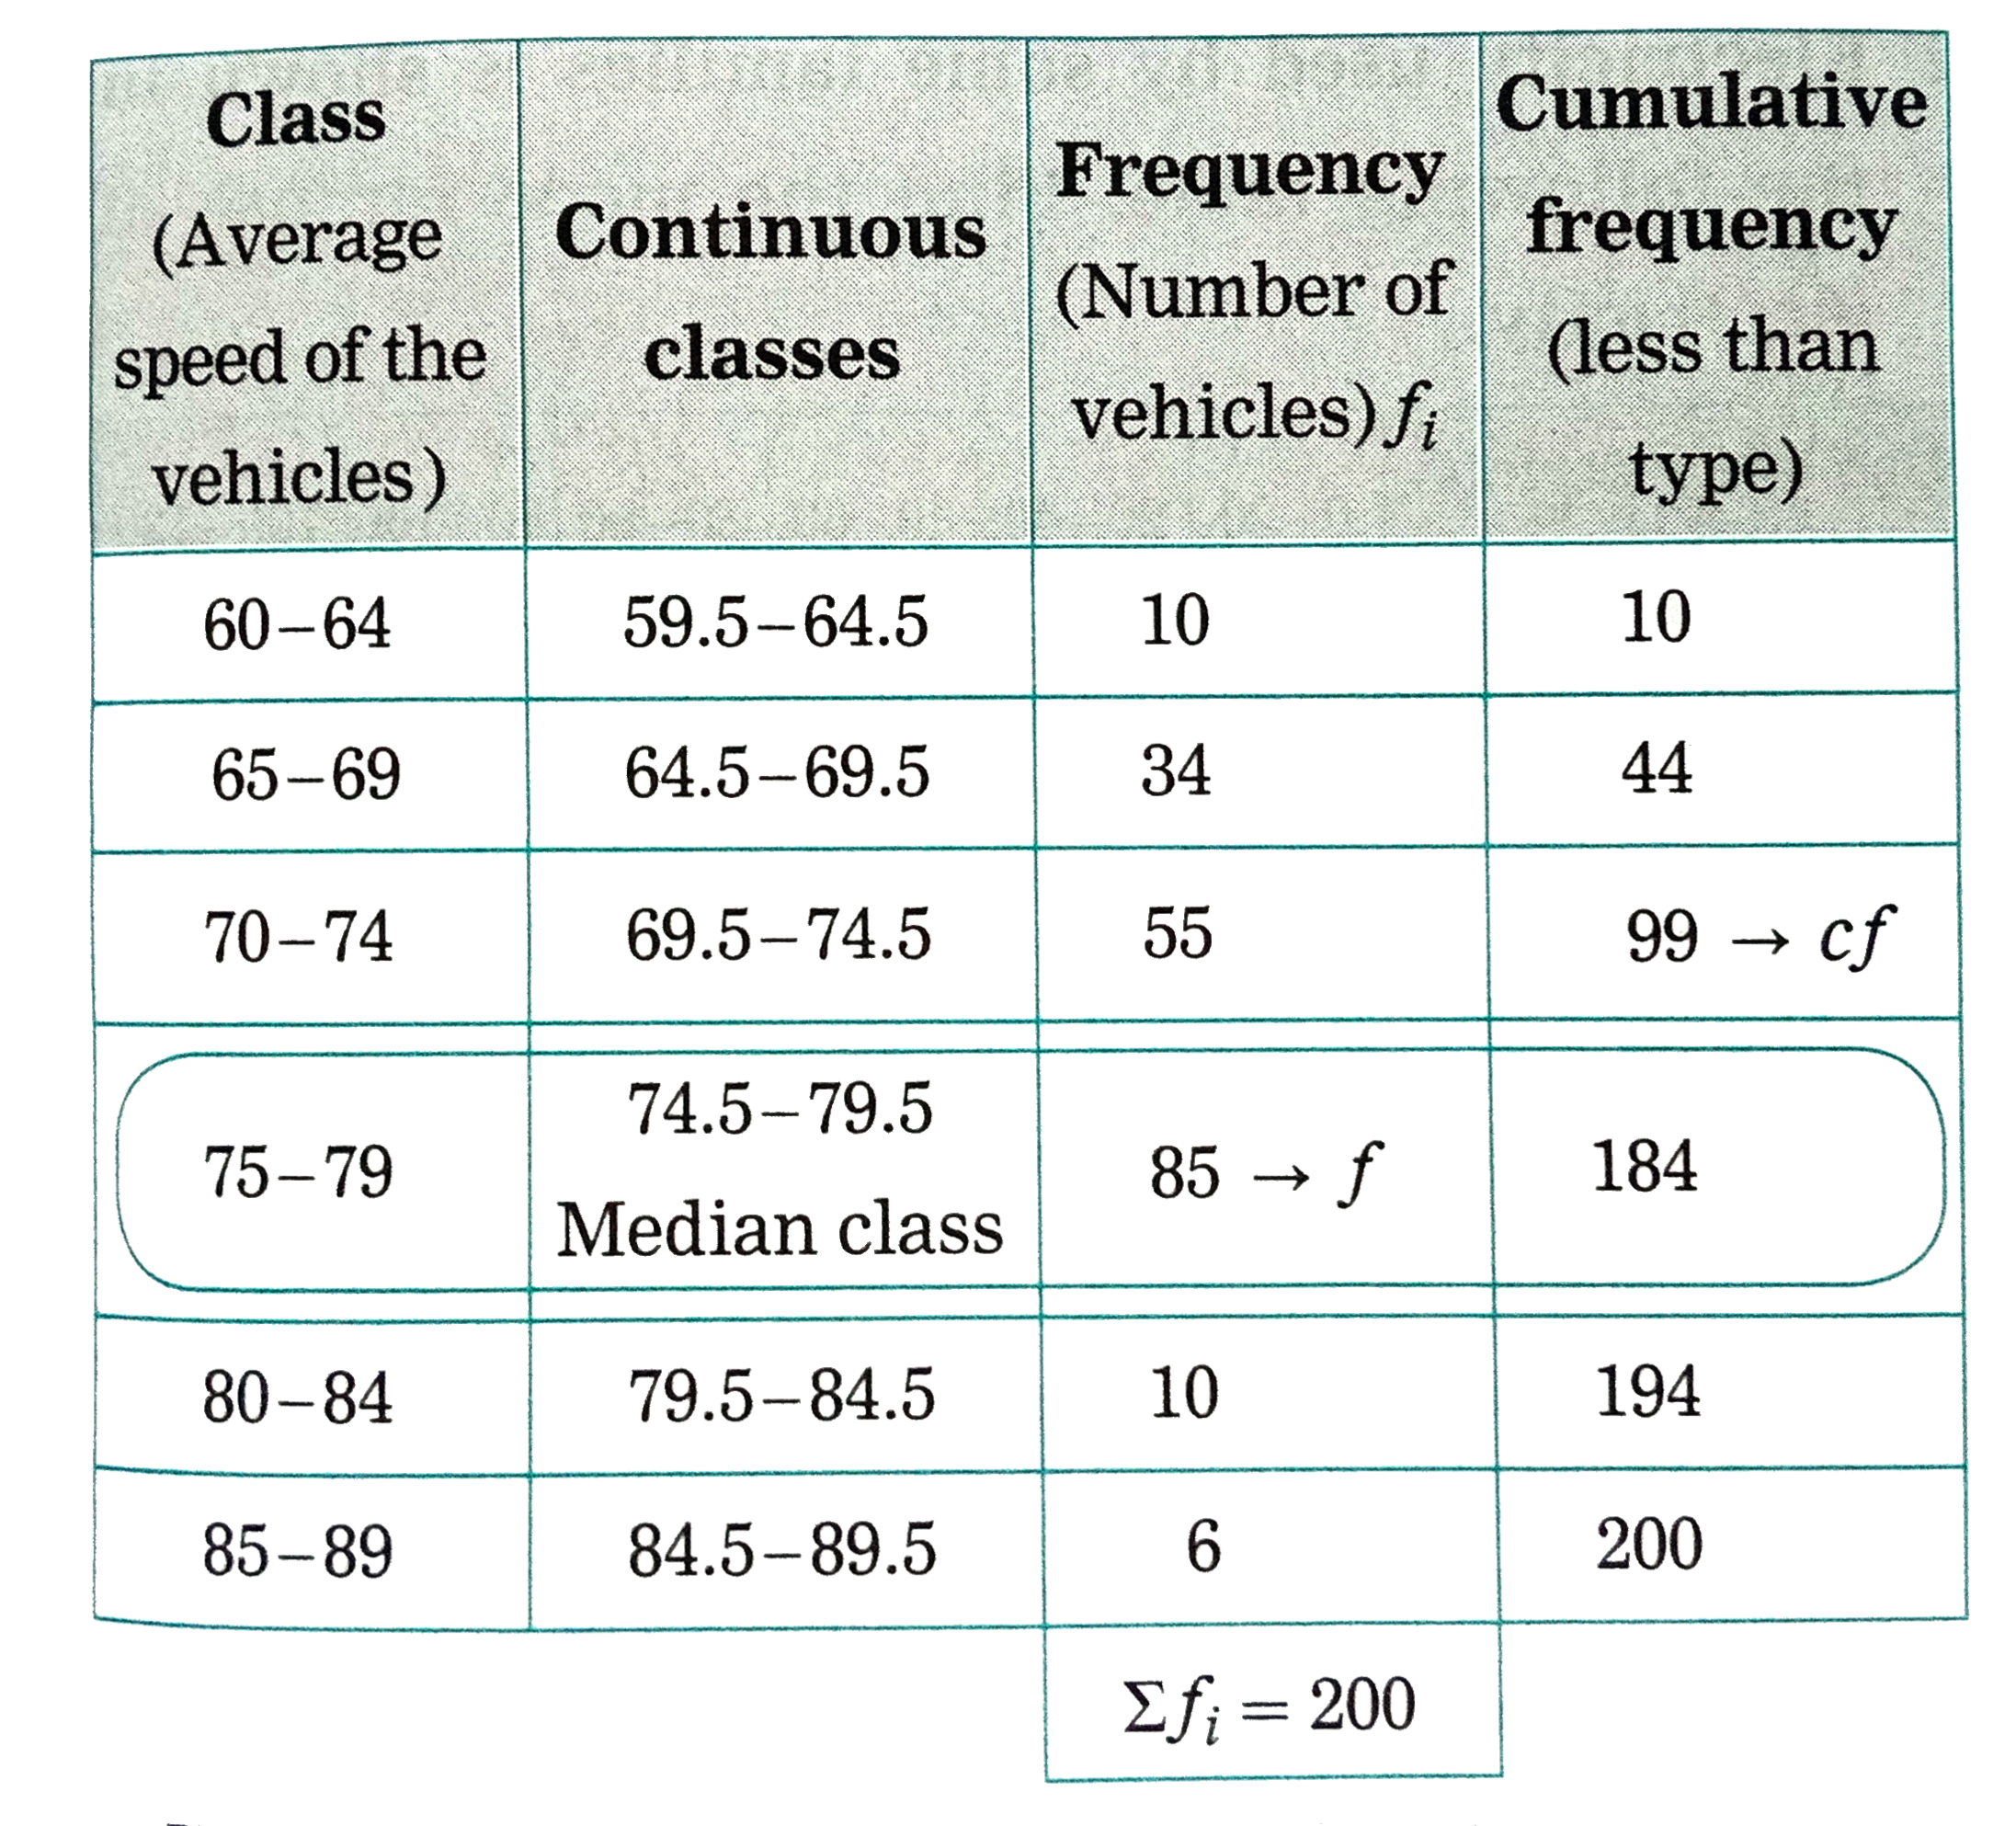
The following table shows the classification of number of vehicles and their speeds on Mumbai - Pune expressway. Find the median of the data .

The correct Answer is:The median of the data is 75 vehicles.
The classes ( Average speed of vehicles) in the table are not continuous.
To find the median, the classes must be continuous.
The difference between the upper class limit of a class and the lower class limit of it succeeding class is 1.
∴ subtract 1÷2=0.5 from the lower class limit of each class and add 0.5 to the upper class limit of each class.
Make a column of cf ( less than type) in the new table showing the continuous classes.

Here, total of frequencies N=Σfi=200.
∴N2=2002=100
Cumulative frequency which is greater than 100 is 184.
∴ the corresponding continuous class 74.5−79.5 is the median class.
L=74.5,f=85,cf=99,h=5
Median =L+⎡⎣N2−cff⎤⎦×h
=74.5+100−9985×5
=74.5+117
=74.5+0.06 (Approx.)
=74.56
But the number of vehicles cannot be in fraction
So, 74.56≈75.
Topper's Solved these Questions
- STATISTICSBOOK - NAVNEET PUBLICATION - MAHARASHTRA BOARDCHAPTER - STATISTICSEXERCISE - PRACTICE SET 6.3
4 Videos
- STATISTICSBOOK - NAVNEET PUBLICATION - MAHARASHTRA BOARDCHAPTER - STATISTICSEXERCISE - PRACTICE SET 6.4
4 Videos
- STATISTICSBOOK - NAVNEET PUBLICATION - MAHARASHTRA BOARDCHAPTER - STATISTICSEXERCISE - PRACTICE SET 6.1
6 Videos
- SIMILARITYBOOK - NAVNEET PUBLICATION - MAHARASHTRA BOARDCHAPTER - SIMILARITYEXERCISE - SUBJECTIVE TYPE
20 Videos
- THEOREMS BOOK - NAVNEET PUBLICATION - MAHARASHTRA BOARDCHAPTER - THEOREMS EXERCISE - CIRCLE
15 Videos
Similar Questions
The following table shows the classification of number of vehicles and their speeds on Mumbai-Pune express way. Find the median of the data.

View SolutionThe following table shows the classification of number of vehicles and their speeds on Mumbai-pune express way.Find the median of the data.

View SolutionFind the median of the following data.
View SolutionFind the median of the following data.

View SolutionFind the median of the following data

View SolutionFind the median of the following data :

View SolutionFind the median of the following data :

View SolutionFind the median of the following data :

View SolutionThe following table shows classification of number of workers and the number of hours they work in a software company. Find the median of the number of hours they work.

View SolutionThe following table shows classification of number of workers and the number of hours they work in a software company. Find the median of the number of hours they work.

View Solution
