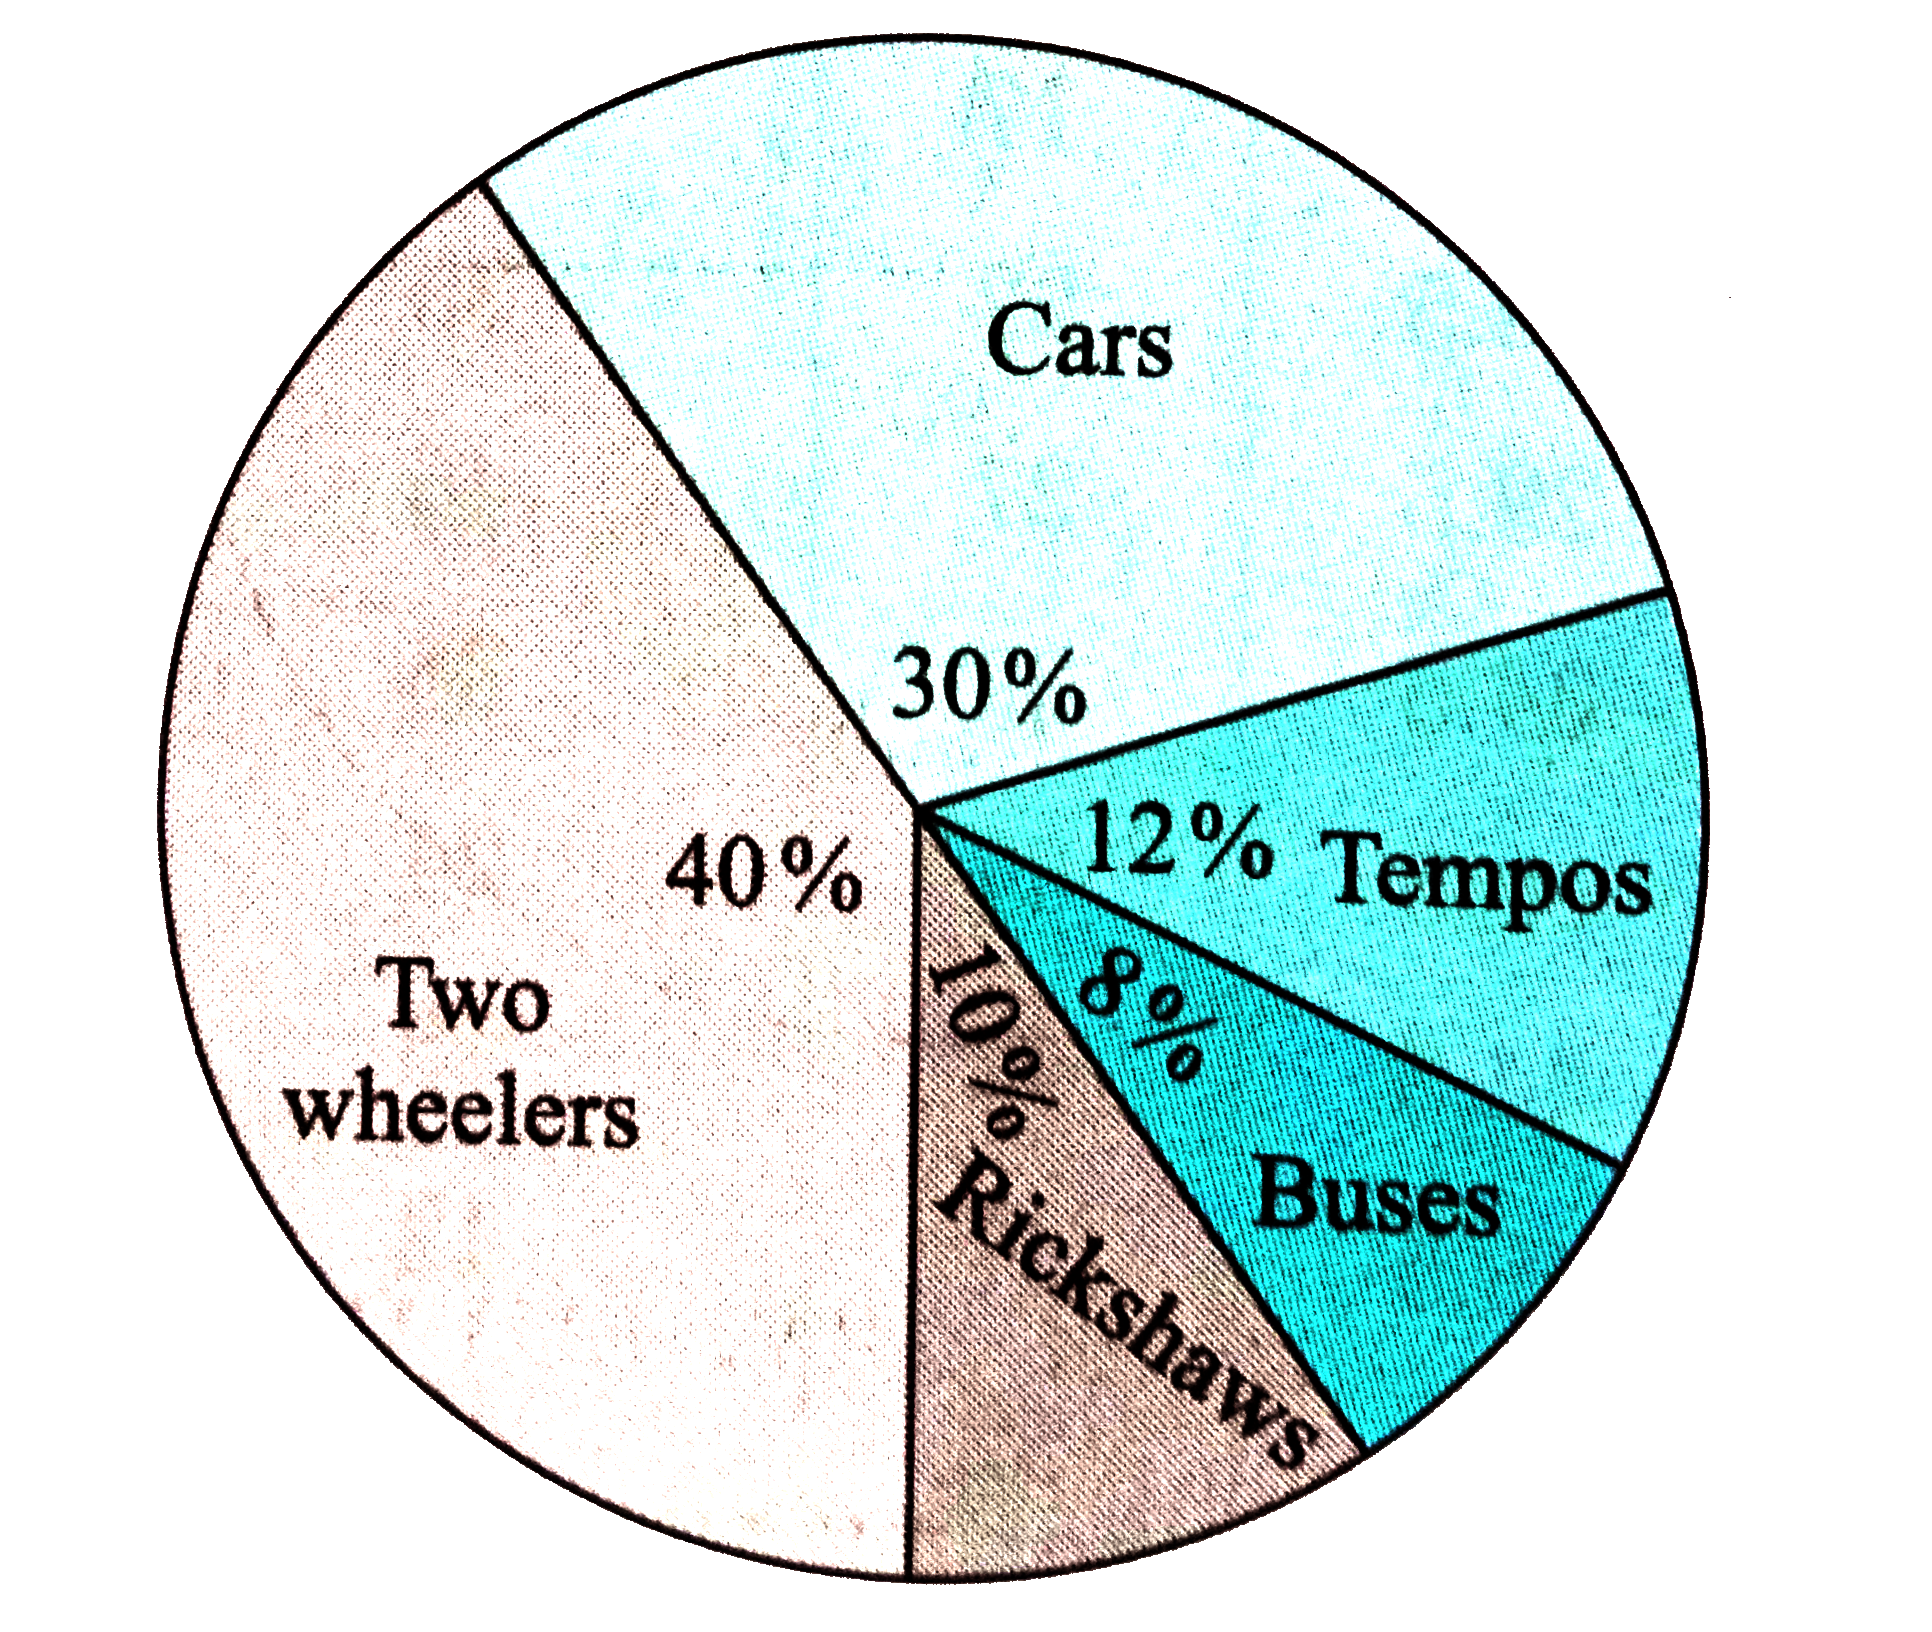
Observe the pie diagram given below .It shows the percentages of number of vehicles passing a signal in a town between 8 am and 10 am.

Find the central angle for each type of vehicle.
The correct Answer is:Cars : 108∘, Tempos : 43∘, Buses : 29∘, Autorickshaws : 36∘, Two wheelers : 144∘.
(i) The central angle for cars =30%100×360∘=108∘
(ii) The central angle for tempos
=12%100×360∘=43.2≈43∘
(iii) The central angle for buses
=8%100×360∘=28.8≈29∘
(iv) The central for autorickshaws
=10%100×360∘=36∘
(v) The central angle for two wheelers
=40%100×360∘=144∘
Topper's Solved these Questions
- BOOK - NAVNEET PUBLICATION - MAHARASHTRA BOARDCHAPTER - STATISTICSEXERCISE - PRACTICE SET 6.16videos
STATISTICS
- BOOK - NAVNEET PUBLICATION - MAHARASHTRA BOARDCHAPTER - STATISTICSEXERCISE - PRACTICE SET 6.24videos
STATISTICS
- BOOK - NAVNEET PUBLICATION - MAHARASHTRA BOARDCHAPTER - STATISTICSEXERCISE - EXAMPLES3videos
STATISTICS
- BOOK - NAVNEET PUBLICATION - MAHARASHTRA BOARDCHAPTER - SIMILARITYEXERCISE - SUBJECTIVE TYPE20videos
SIMILARITY
- BOOK - NAVNEET PUBLICATION - MAHARASHTRA BOARDCHAPTER - THEOREMS EXERCISE - CIRCLE15videos
THEOREMS
Similar Questions
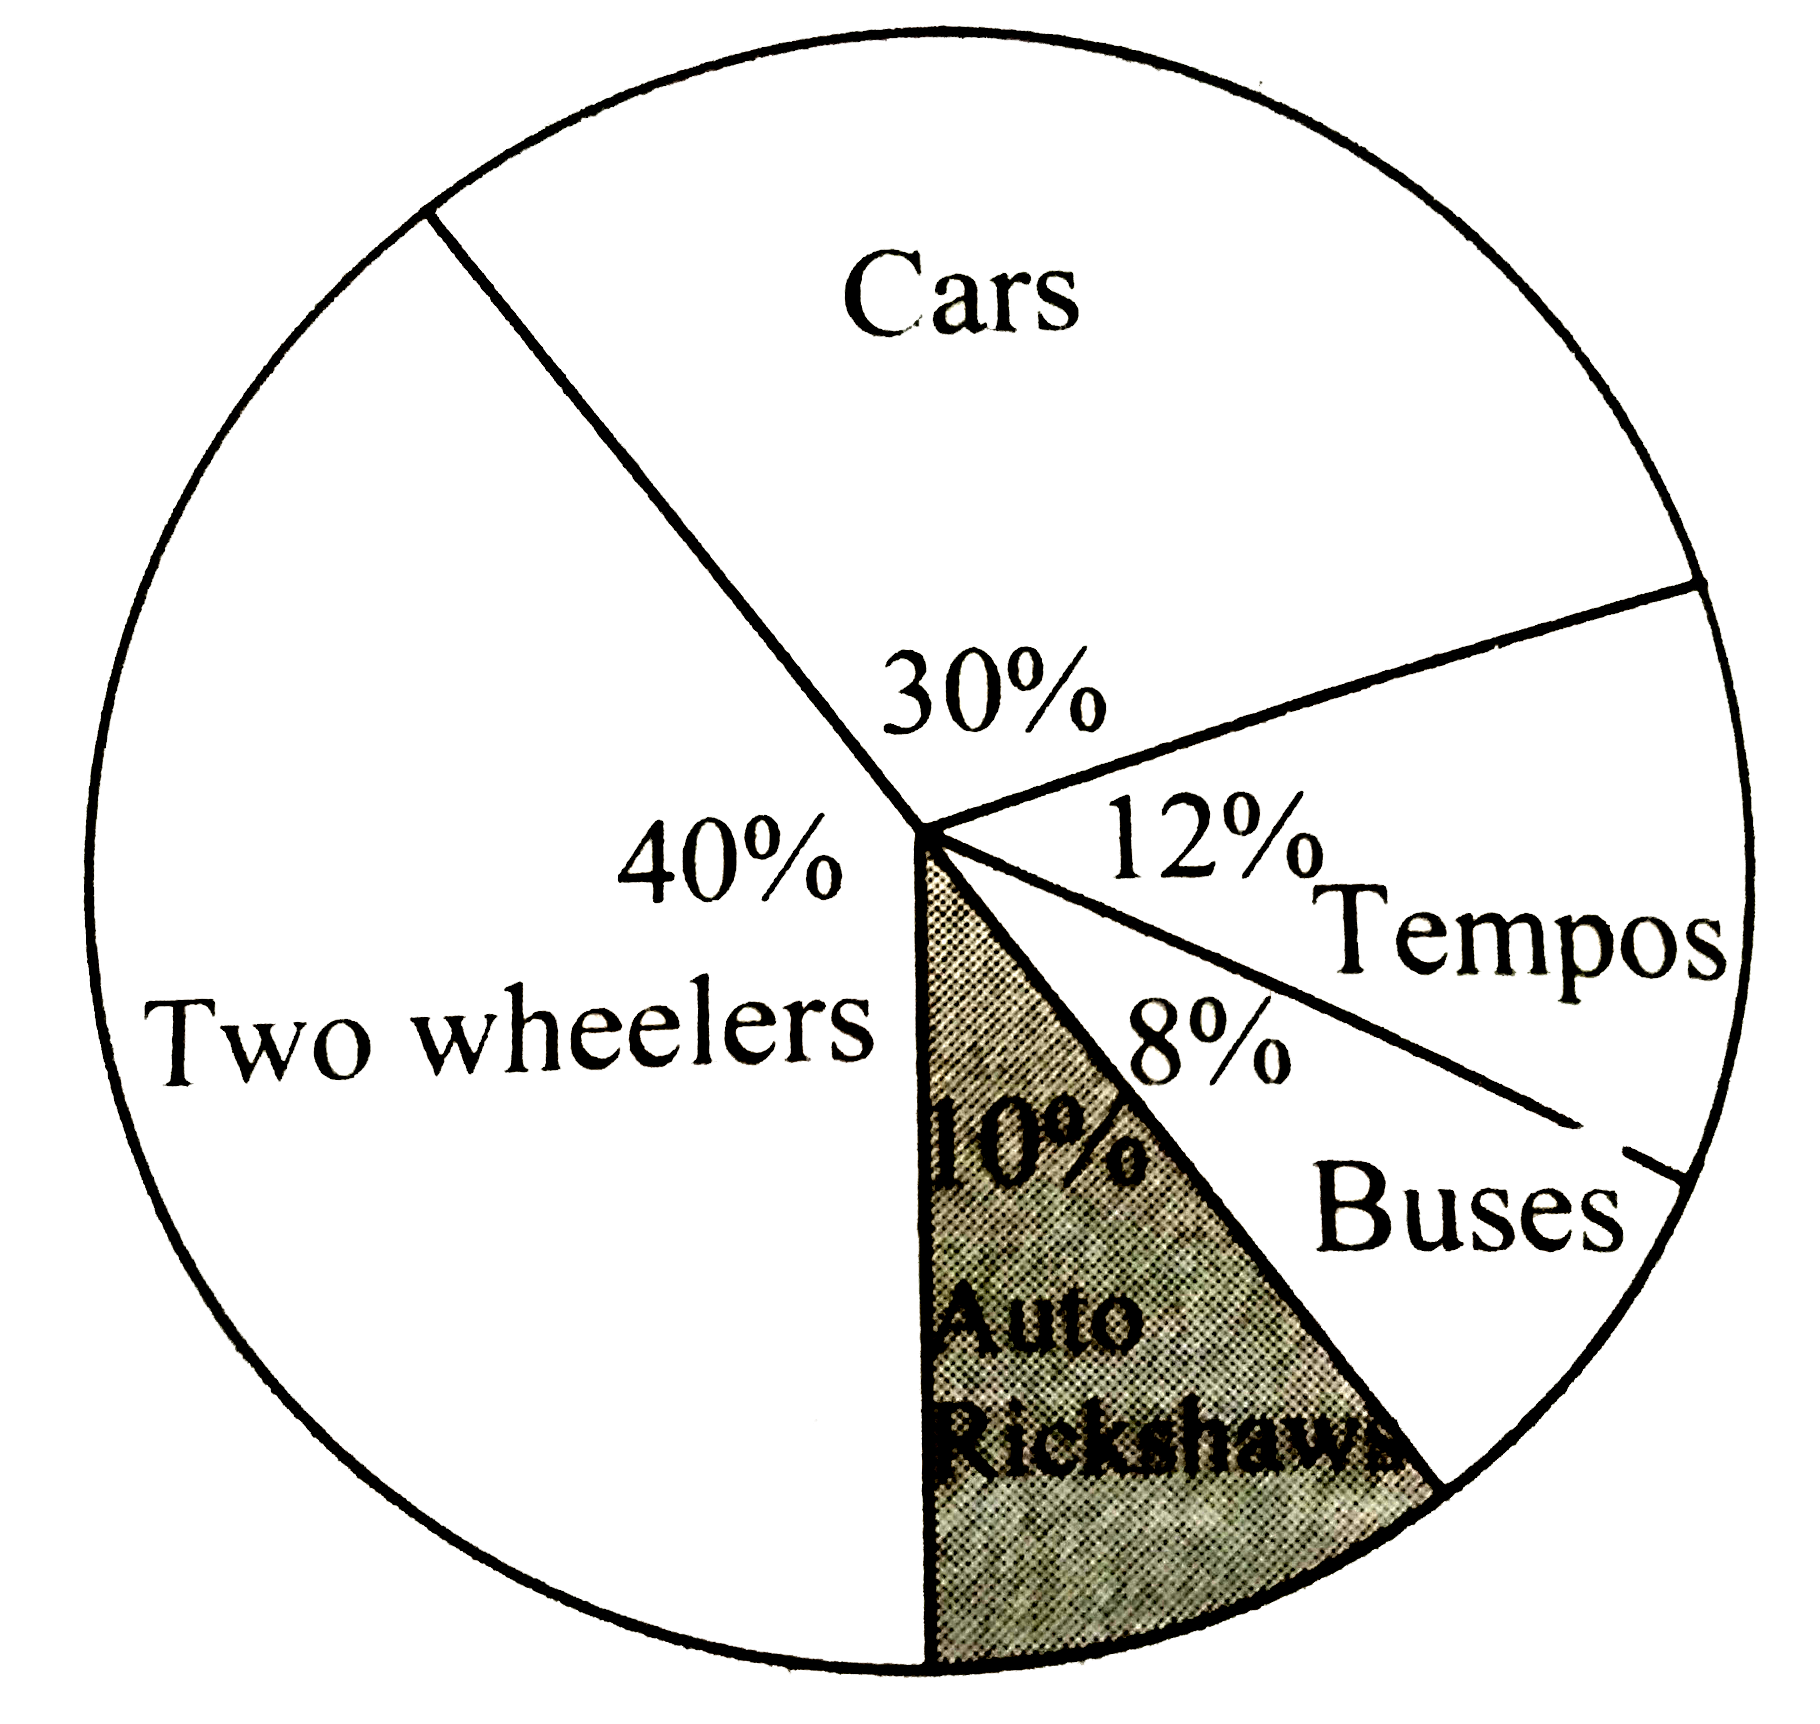
Observe the given pie diagram. It shows the percentages of number of vehicles passing a signal in a town between 8am and 10 am.
i. Find the central angle for each type of vehicle.
ii. If the number of two-wheelers is 1200, find the number of all vehicles.
 View Solution
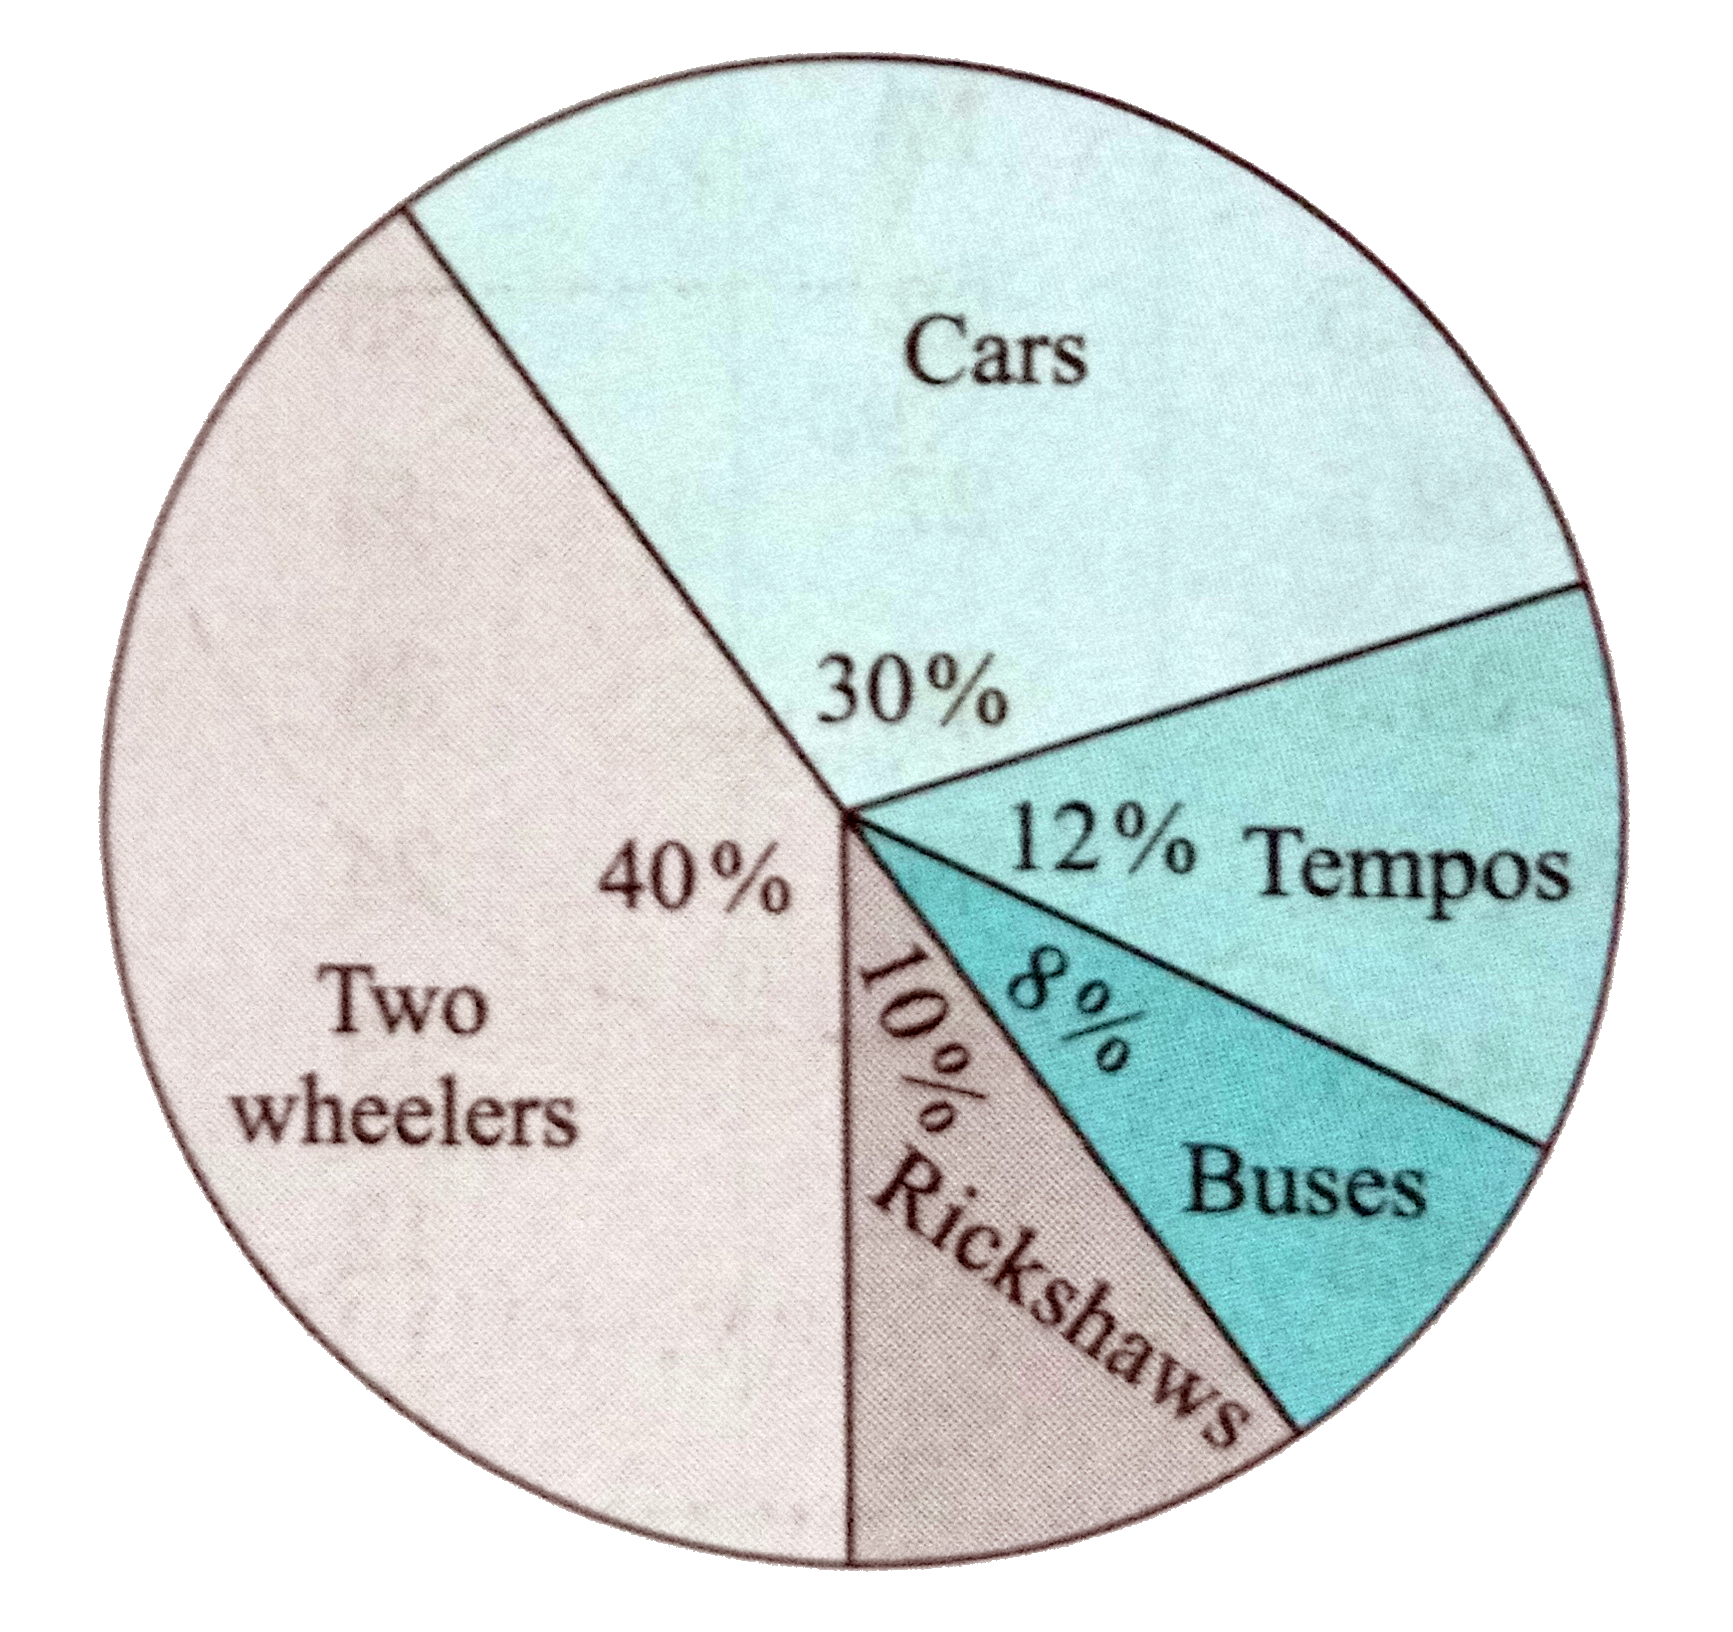
Observe the pie diagram given below .It shows the percentages of number of vehicles passing a signal in a town between 8 am and 10 am.

If the number of two - wheelers is 1200, find the number of all vehicles.View SolutionObserve the figures given below and write the type of each of the angles :
 View Solution
Observe the figures given below and write the type of each of the angles :
 View Solution
Observe the figures given below and write the type of each of the angles :
 View Solution
Observe the figures given below and write the type of each of the angles :
 View Solution
Observe the figures given below and write the type of each of the angles :
 View Solution
Observe the figures given below and write the type of each of the angles :
 View Solution
The following table shows the percentage of vehicles passing a signal. Find out the measures of the central angles to show the information by a pie diagram. Hence draw the pie diagram.
 View Solution
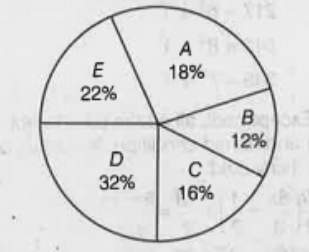
Direction :- Given below is the pie chart which shows the percentage distribution of a book 'XYZ'.
Published in 5 different stores.

Total number of books = 550
Find the central angle for the book D.View Solution

