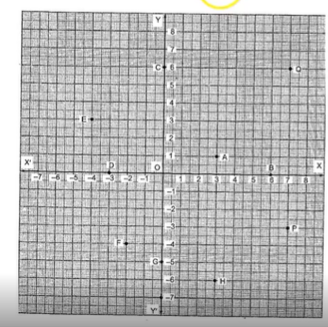
Plet each of the following points on a graph paper :
A(5,2)
To plot the point A(5, 2) on graph paper, follow these steps:
1. Draw the Axes:
- Begin by drawing a horizontal line across the center of your graph paper. This line is called the x-axis.
- Next, draw a vertical line that intersects the x-axis at the center. This line is called the y-axis.
2. Label the Axes:
- Label the horizontal line as the x-axis and the vertical line as the y-axis.
- Mark equal intervals on both axes. For example, you can mark 1 unit for each box on the graph paper.
3. Mark the X-Coordinate:
- Locate the x-coordinate of the point A, which is 5.
- Starting from the origin (where the x-axis and y-axis intersect), count 5 units to the right along the x-axis. Place a small mark at this point.
4. Mark the Y-Coordinate:
- Now, locate the y-coordinate of the point A, which is 2.
- From the mark you made at x = 5, move vertically upwards 2 units along the y-axis. Place a small mark at this point.
5. Plot the Point:
- The point A(5, 2) is where the two marks intersect.
- Draw a small dot at this intersection and label it as A.
Final Visualization:
- You should now see the point A plotted at the coordinates (5, 2) on your graph paper.
---
- Begin by drawing a horizontal line across the center of your graph paper. This line is called the x-axis.
- Next, draw a vertical line that intersects the x-axis at the center. This line is called the y-axis.
- Label the horizontal line as the x-axis and the vertical line as the y-axis.
- Mark equal intervals on both axes. For example, you can mark 1 unit for each box on the graph paper.
- Locate the x-coordinate of the point A, which is 5.
- Starting from the origin (where the x-axis and y-axis intersect), count 5 units to the right along the x-axis. Place a small mark at this point.
- Now, locate the y-coordinate of the point A, which is 2.
- From the mark you made at x = 5, move vertically upwards 2 units along the y-axis. Place a small mark at this point.
- The point A(5, 2) is where the two marks intersect.
- Draw a small dot at this intersection and label it as A.
- You should now see the point A plotted at the coordinates (5, 2) on your graph paper.
Topper's Solved these Questions
- BOOK - MTG IIT JEE FOUNDATIONCHAPTER - INTRODUCTION TO GRAPHS EXERCISE - NCERT SECTIONS (15.1)7videos
INTRODUCTION TO GRAPHS
- BOOK - MTG IIT JEE FOUNDATIONCHAPTER - INTRODUCTION TO GRAPHS EXERCISE - NCERT SECTIONS (15.2)6videos
INTRODUCTION TO GRAPHS
- BOOK - MTG IIT JEE FOUNDATIONCHAPTER - INTRODUCTION TO GRAPHS EXERCISE - OLYMPIAD/HOTS CORNER5videos
INTRODUCTION TO GRAPHS
- BOOK - MTG IIT JEE FOUNDATIONCHAPTER - FOOTSTEPS TOWARDS JEE MAINEXERCISE - Section B (Numerical Value Type Questions)9videos
FOOTSTEPS TOWARDS JEE MAIN
- BOOK - MTG IIT JEE FOUNDATIONCHAPTER - LINEAR EQUATIONS IN ONE VARIABLEEXERCISE - Olympiad/HOTS Corner15videos
LINEAR EQUATIONS IN ONE VARIABLE
Similar Questions
Plet each of the following points on a graph paper :
B(-2,4)View SolutionPlet each of the following points on a graph paper :
D(4,-3)View SolutionPlot each of the following points on a graph paper: (i) A(5, 2) (ii) B(-2, 4) (iii) C(-4, -6) (iv) D(4, -3)
View SolutionPlet each of the following points on a graph paper :
C(-4,-6)View SolutionPlot the following points on a graph paper:
(2,2)View SolutionPlot the following points on a graph paper:
(3,2)View SolutionPlot each of the following points on a graph paper:
(i) (-3, 0)
(ii) (3, 0)
(iii) (0, -3)
(iv) (0, 3)View SolutionPlot the following points on the graph paper : P(3,0) (ii) Q(−4,0) R(0,5) (iv) S(0,−7) (fig)
View SolutionPlot the following points on the graph paper:
(i) (2,5)
(ii) (4,−3)
(iii) (−5,−7)
(iv) (7,−4)
(v) (−3,2)
(vi) (7,0)
(vii) (−4,0)
(viii) 0,7)
( ix) 0,−4)
(x) (0,0)View SolutionWrite the coordinates of each of the following points marked in the graph paper:
 View Solution

