The sales of a shopkeeper in the first week of january 2012, are given below :

Draw a graph representing the above data.
Step by step video & image solution for The sales of a shopkeeper in the first week of january 2012, are given below : Draw a graph representing the above data. by Maths experts to help you in doubts & scoring excellent marks in Class 8 exams.
Updated on:21/07/2023Topper's Solved these Questions
- INTRODUCTION TO GRAPHS BOOK - MTG IIT JEE FOUNDATIONCHAPTER - INTRODUCTION TO GRAPHS EXERCISE - NCERT SECTIONS (15.1)
7 Videos
- INTRODUCTION TO GRAPHS BOOK - MTG IIT JEE FOUNDATIONCHAPTER - INTRODUCTION TO GRAPHS EXERCISE - NCERT SECTIONS (15.2)
6 Videos
- INTRODUCTION TO GRAPHS BOOK - MTG IIT JEE FOUNDATIONCHAPTER - INTRODUCTION TO GRAPHS EXERCISE - OLYMPIAD/HOTS CORNER
5 Videos
- FOOTSTEPS TOWARDS JEE MAINBOOK - MTG IIT JEE FOUNDATIONCHAPTER - FOOTSTEPS TOWARDS JEE MAINEXERCISE - Section B (Numerical Value Type Questions)
9 Videos
- LINEAR EQUATIONS IN ONE VARIABLEBOOK - MTG IIT JEE FOUNDATIONCHAPTER - LINEAR EQUATIONS IN ONE VARIABLEEXERCISE - Olympiad/HOTS Corner
15 Videos
Similar Questions
The runs scored by a cricket team in first 10 overs are given below:

Draw a line graph representing the above data.
View SolutionThe sales of a shopkeeper in the first week of January 2002, are given below
Date:, 1, 2, 3, 4, 5, 6, 7
Sales (in Rs), 5000, 5100, 4900, 5800, 6000, 5500, 5200
Draw a graph representing the above data.
View SolutionDraw a histogram to represent the following data.

View Solution70 students from a locality use different modes of transport to go to school as given below:
 Draw the bar graph representing the above data.
View Solution70 students from a locality use different modes of transport to go to school as given below:

Draw the bar graph representing the above data.
View SolutionThe approximate speeds of some objects are given below. Draw a bar graph to represent them:

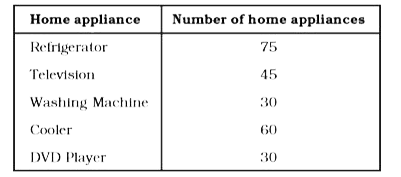
View SolutionHome appliances sold by a shop in one month are given as below:

Draw a bar graph to represent the above information.
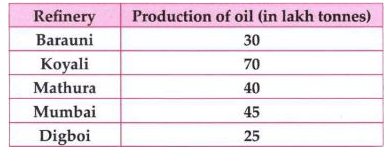
View SolutionThe production of oil (in lakh tonnes) in some of the refineries in India during 2008 is given below :

Construct a bar graph to represent the above data
View SolutionIn a class of 40 students, the marks obtained (out of 50) are as given below:

Draw a histogram to represent the given data.
View SolutionDraw the histogram to represent the following data.

View Solution
