Read the
bar graph given in Figure and answer the following questions:
What
information does it give?
In which
part of the expenditure on education is maximum in
1980?
In which
part of the expenditure has gone up from 1980 to 1990?
In which
part of the gap between 1980 and 1990 is maximum?
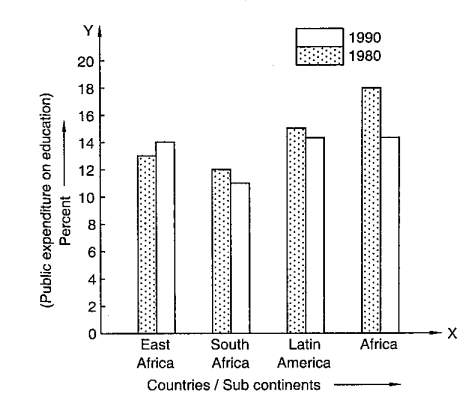
(i)The above bar graph gives information on the Public Expenditure on Education in different countries and Sub- continents for the year 1980 and 1990
(ii)In 1980 the expenditure on education is maximum in Africa
(iii)The expenditure has gone up in 1980 to 1990 in East Africa
(iv) The gap between 1980 and 1990 is maximum in Africa.
Topper's Solved these Questions
Similar Questions
Read the following bar graph given in figure and answer the following questions.
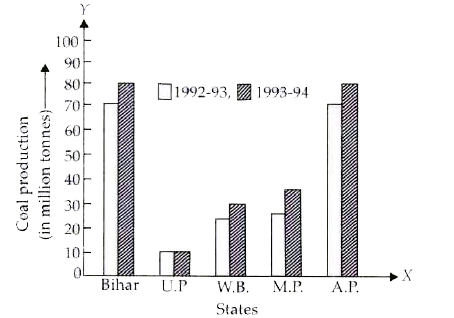
(i) What information is given by this bar graph?
View SolutionRead the bar graph shown in figure and answer the following questions.
What is the information given by the bar graph?
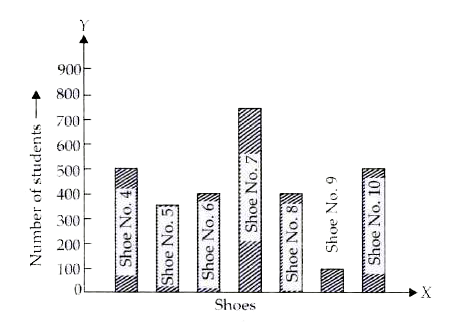
View SolutionRead the following bar graph given in figure and answer the following questions.
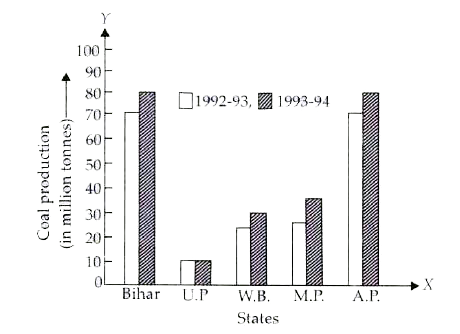
Which state has minimum production?
View SolutionRead the following bar graph given in figure and answer the following questions.
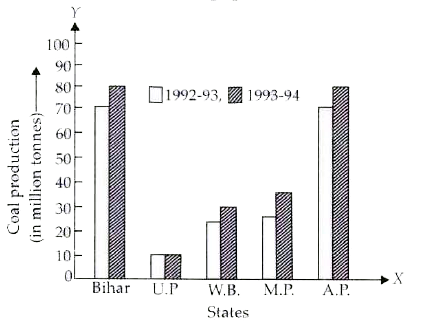
Which two states have same production in 1993-94?
View SolutionRead the graph and answer the following questions
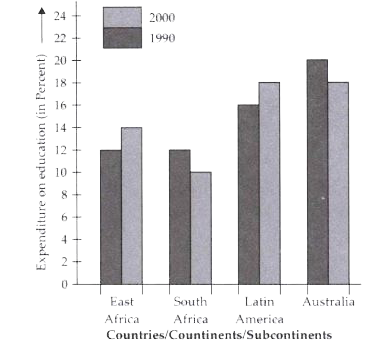
In which part the expenditure on education is maximum in 1990?
View SolutionRead the bar graph given below and answer the following questions:
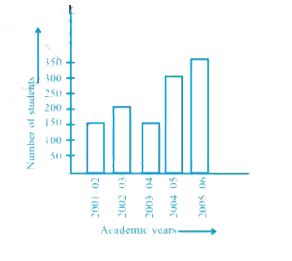
In which year is the number of students maximum?
View SolutionRead the bar graph given below and answer the following questions:
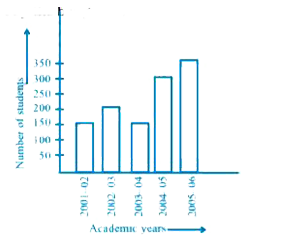
In which year is the number of students twice as that of 2001-02?
View SolutionRead the bar graph shown in figure and answer the following questions.
Which shoe number is worn by the maximum number of students? Also give its number
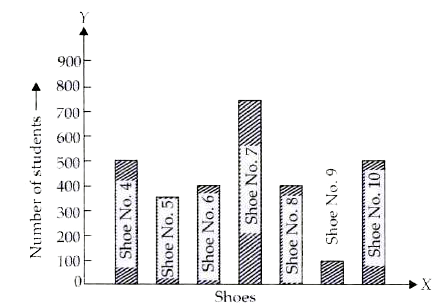
View SolutionRead the bar graph carefully and answer the following questions.
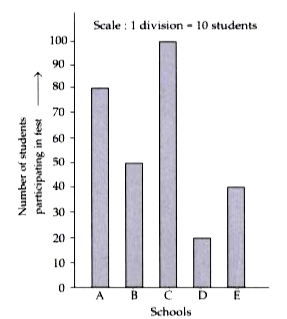 From which school maximum number of students participated ?
View SolutionRead the bar graph given below and answer the following questions:
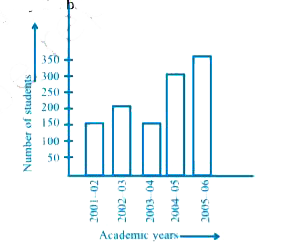
In which year is the increase in number of students maximum as compared to the previous year?
View Solution
