The results
of pass percentage of Class X and XII in C.B.S.E. examination for 5 years are
given in the following table:

Draw bar
graphs to represent the data
Topper's Solved these Questions
Similar Questions
The results of pass percentage of Class X and XII in C.B.S.E examination for 5 years are given in the following table: Year, 1994-95, 1995-96, 1996-97, 1997-98, 1998-99 X, 90, 95, 90, 80, 98 XII, 95, 80, 85, 90, 95 Draw bar graphs to represent the data
View SolutionDraw a bar graph using the data given in the following table.

View SolutionThe income of a family i different year are as follows. Draw a bar graph to represent the data
View SolutionThe expenditure of a family of different heads in a month is given below

Draw a bar graph to represent the data above.
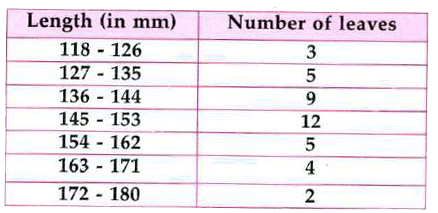
View SolutionThe length of 40 leaves of a plant are measured correct to one millimetre, and the obtained data is represented in the following table:

Draw a histogram to represent the given data. [Hint: First make the class intervals continuous]
View SolutionDraw a line graph to represent the runs made by different batsmen in a match whose details are given in the following table:

View SolutionGiven below is the data of school going students (boys and girls):

Draw the bar graph to represent the above data.
View Solution70 students from a locality use different modes of transport to go to school as given below:

Draw the bar graph representing the above data.
View Solution70 students from a locality use different modes of transport to go to school as given below:
 Draw the bar graph representing the above data.
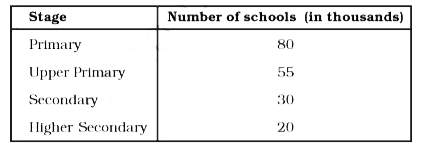
View SolutionThe following table gives the data of number of schools (stage-wise) of a country in the year 2002.

Draw a bar graph to represent the above data:
View Solution
