The
following data gives the number of students of Delhi state who went abroad
for study during some years:

Represent
the above data with the help of a bar graph.
Step by step video & image solution for The following data gives the number of students of Delhi state who went abroad for study during some years: Represent the above data with the help of a bar graph. by Maths experts to help you in doubts & scoring excellent marks in Class 9 exams.
Topper's Solved these Questions
Similar Questions
The following data gives the number of students of Delhi state who went abroad for study during some years: year: 1995 1996 1997 1998 1999 2000 No. of Students 1400 1600 1250 1000 2000 2200 Represent the above data with the help of a bar graph.
View SolutionThe following data gives the number of students of Delhi state who went abroad for study during some years: year 1995 1996 1997 1998 1999 2000 No. of Students 1400 1600 1250 1000 2000 2200 Represent the above data with the help of a bar graph.
View Solution
Knowledge Check
- Question 1 - Select One
Study the following data and answer the questions.

Number of students whose IQ score is 140 isAundeterminable fom given dataB2C1D0
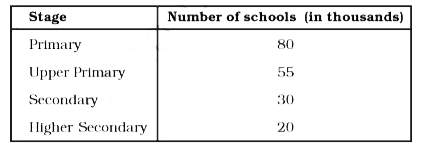
The following table gives the data of number of schools (stage-wise) of a country in the year 2002.

Draw a bar graph to represent the above data:View SolutionThe followings data give the number of boys of a particular age in a class of 40 students

Calculate the mean age of the students.View SolutionThe following data shows the number of students who attended the school on weekdays. Draw a bar graph to represent information by using appropriate scale.
 View Solution
The following table gives the data on the marks obtained by two students 'A and B' in five subjects :

Represent the data by a multiple bar diagram.View SolutionThe following table shows the number of fruits in a fruit shop. Represent the above data by a bar graph
View Solution. The following data shows the year wise strength of a school.Represent the the above data by bar graph:
View SolutionIn a school, there are five sections of Class VI. The number of students in each section is given below:

Represent the above data using a bar graph.View Solution

