Sketech the graph of f(x) = [x].
To sketch the graph of the function f(x)=(x), where (x) denotes the greatest integer function (also known as the floor function), we will follow these steps:
Step 1: Understand the Greatest Integer Function
The greatest integer function (x) returns the largest integer less than or equal to x. This means:
- For any integer n, (n)=n.
- For any non-integer x in the interval (n,n+1), (x)=n.
Step 2: Identify Key Points
We will evaluate the function at several key points:
- For x=0, (0)=0
- For x=0.5, (0.5)=0
- For x=1, (1)=1
- For x=1.5, (1.5)=1
- For x=2, (2)=2
- For x=2.5, (2.5)=2
- For x=3, (3)=3
- For x=3.5, (3.5)=3
- For x=−1, (−1)=−1
- For x=−0.5, (−0.5)=−1
- For x=−2, (−2)=−2
- For x=−1.5, (−1.5)=−2
Step 3: Plot the Points
Now, we will plot the points on a Cartesian plane:
- For x in the interval (0,1), f(x)=0 (open circle at x=0 and closed circle at x=1).
- For x in the interval (1,2), f(x)=1 (open circle at x=1 and closed circle at x=2).
- For x in the interval (2,3), f(x)=2 (open circle at x=2 and closed circle at x=3).
- For x in the interval (3,4), f(x)=3 (open circle at x=3 and closed circle at x=4).
- For negative values, for x in the interval (−1,0), f(x)=−1 (open circle at x=−1 and closed circle at x=0).
- For x in the interval (−2,−1), f(x)=−2 (open circle at x=−2 and closed circle at x=−1).
Step 4: Draw the Graph
Using the points plotted, we can now draw the graph:
- The graph consists of horizontal line segments at each integer value, with open circles at the right endpoint of each segment and closed circles at the left endpoint.
- The graph will look like a series of steps, hence the name "step function."
Final Graph
The graph will consist of horizontal segments at each integer level, with the following characteristics:
- It will be continuous from the left but jump to the next integer at each integer value of x.
The greatest integer function (x) returns the largest integer less than or equal to x. This means:
- For any integer n, (n)=n.
- For any non-integer x in the interval (n,n+1), (x)=n.
We will evaluate the function at several key points:
- For x=0, (0)=0
- For x=0.5, (0.5)=0
- For x=1, (1)=1
- For x=1.5, (1.5)=1
- For x=2, (2)=2
- For x=2.5, (2.5)=2
- For x=3, (3)=3
- For x=3.5, (3.5)=3
- For x=−1, (−1)=−1
- For x=−0.5, (−0.5)=−1
- For x=−2, (−2)=−2
- For x=−1.5, (−1.5)=−2
Now, we will plot the points on a Cartesian plane:
- For x in the interval (0,1), f(x)=0 (open circle at x=0 and closed circle at x=1).
- For x in the interval (1,2), f(x)=1 (open circle at x=1 and closed circle at x=2).
- For x in the interval (2,3), f(x)=2 (open circle at x=2 and closed circle at x=3).
- For x in the interval (3,4), f(x)=3 (open circle at x=3 and closed circle at x=4).
- For negative values, for x in the interval (−1,0), f(x)=−1 (open circle at x=−1 and closed circle at x=0).
- For x in the interval (−2,−1), f(x)=−2 (open circle at x=−2 and closed circle at x=−1).
Using the points plotted, we can now draw the graph:
- The graph consists of horizontal line segments at each integer value, with open circles at the right endpoint of each segment and closed circles at the left endpoint.
- The graph will look like a series of steps, hence the name "step function."
The graph will consist of horizontal segments at each integer level, with the following characteristics:
- It will be continuous from the left but jump to the next integer at each integer value of x.
Topper's Solved these Questions
- PIECEWISE FUNCTIONSBOOK - ENGLISH SATCHAPTER - PIECEWISE FUNCTIONSEXERCISE - EXERCISES
8 Videos
- PASSPORT TO ADVANCED MATHBOOK - ENGLISH SATCHAPTER - PASSPORT TO ADVANCED MATHEXERCISE - EXERCISE
80 Videos
- PLANE GEOMETRY/ TRIGONOMETRYBOOK - ENGLISH SATCHAPTER - PLANE GEOMETRY/ TRIGONOMETRYEXERCISE - EXERCISE
12 Videos
Similar Questions
Knowledge Check

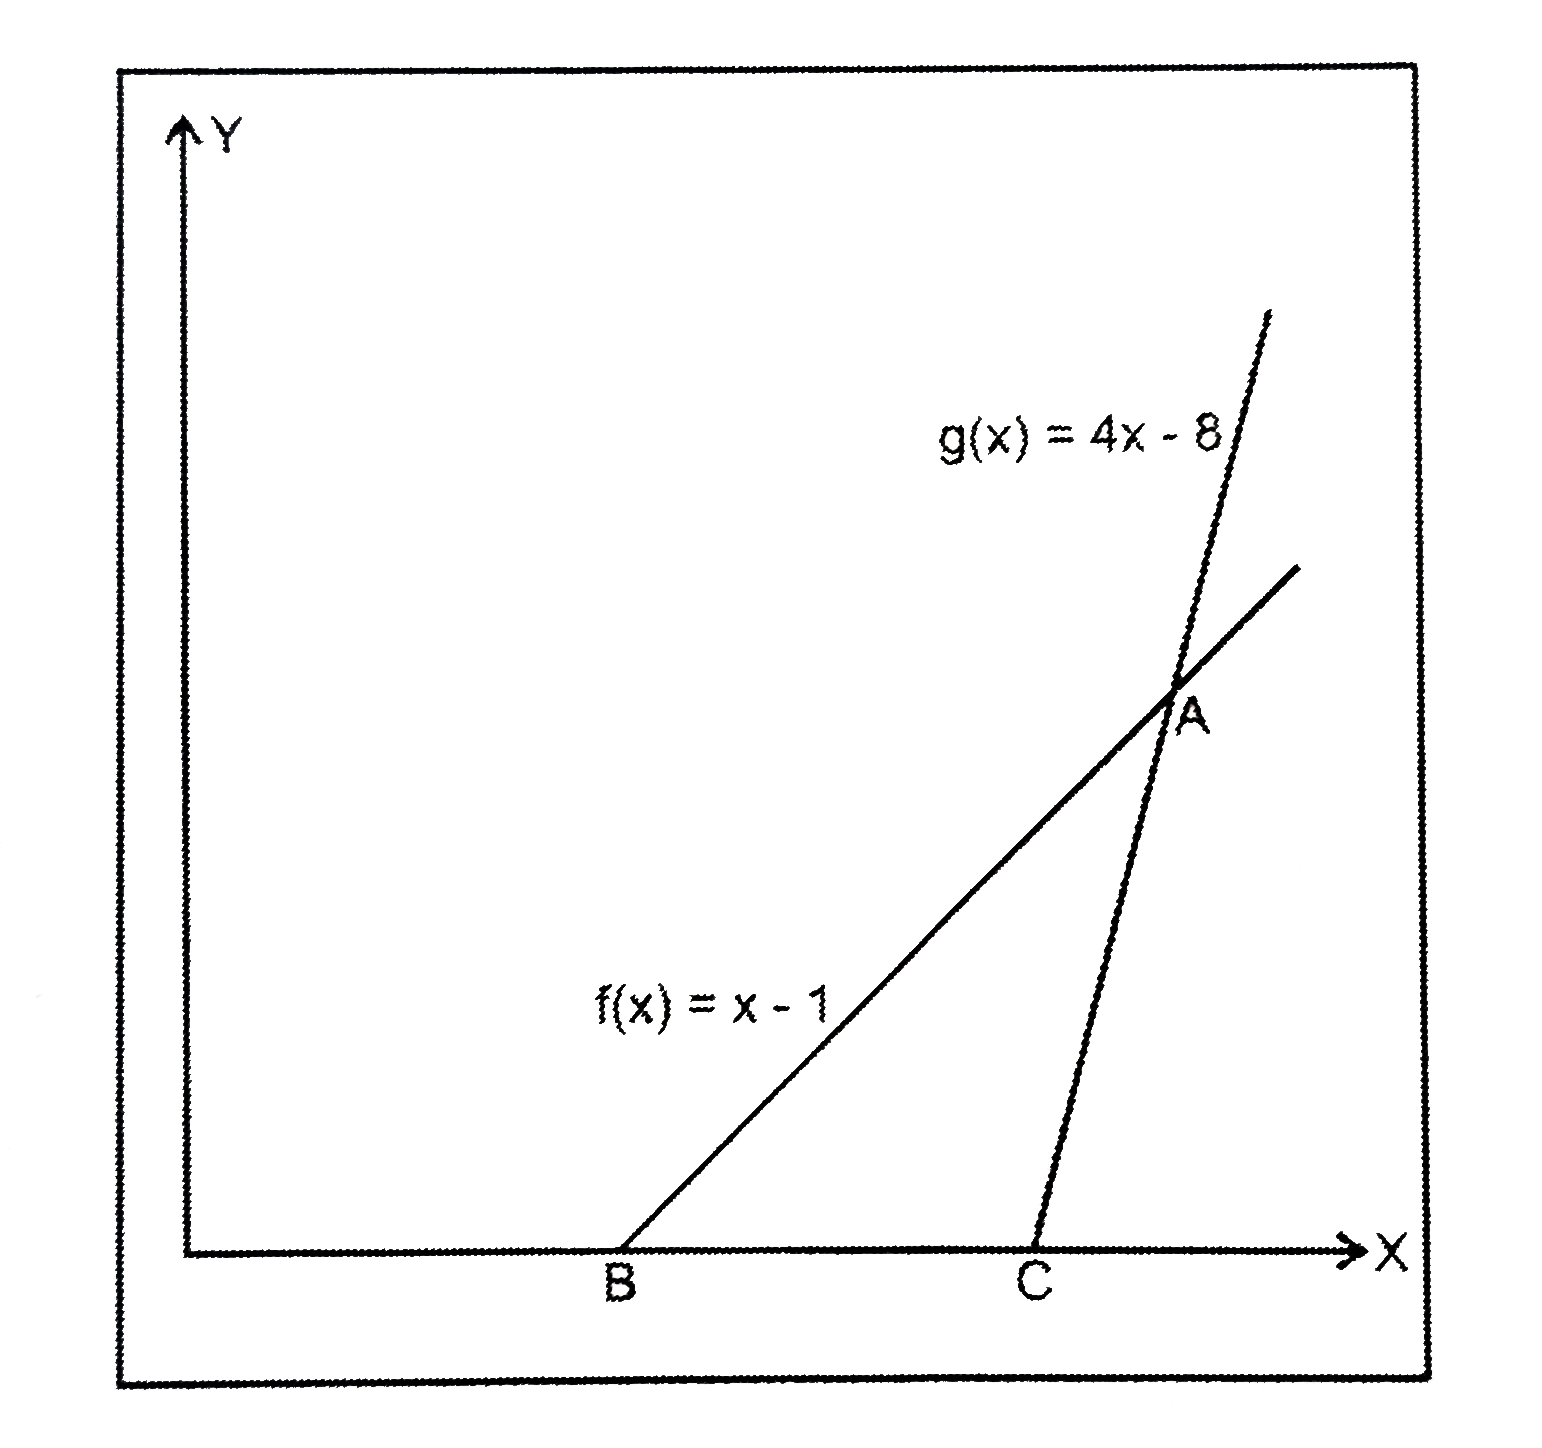
What is the area of the triangle ABC bounded by the graphs of f(x) = x - 1 and g(X) = 4x - 8 and the X -axis as shown in the graph below ?A23B1C43D2
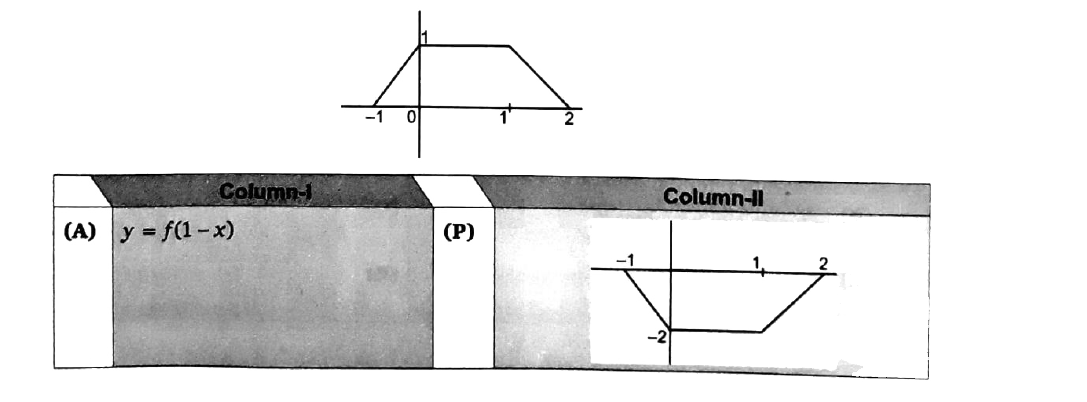
Given the graph of y=f(x)

View SolutionSketch the graph of f(x)=x2−1x+1.
View SolutionSketch the graph of
(i)f(x)=sgn(x2+1)(ii)f(x)=sgn(logex)(iii)f(x)=sgn(sinx)(iv)f(x)=sgn(cosx)
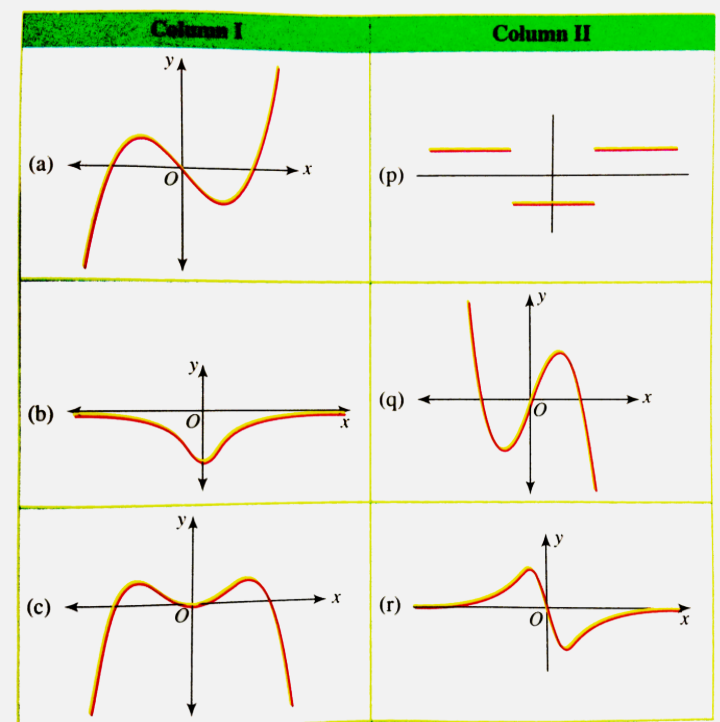
View SolutionMatch the graph of y = f(x) in Column I with the corresponding graph of y = f'(x) in Column II.


View Solutiondraw the graph of f(x)=x+[x], [.] denotes greatest integer function.
View SolutionDraw the graph of f(x)=x+[x], [.] denotes greatest integer function.
View SolutionConsider that the graph of y=f(x) is symmetrie about the lines x=2andx=4 then the period of f(x) is
View Solution
