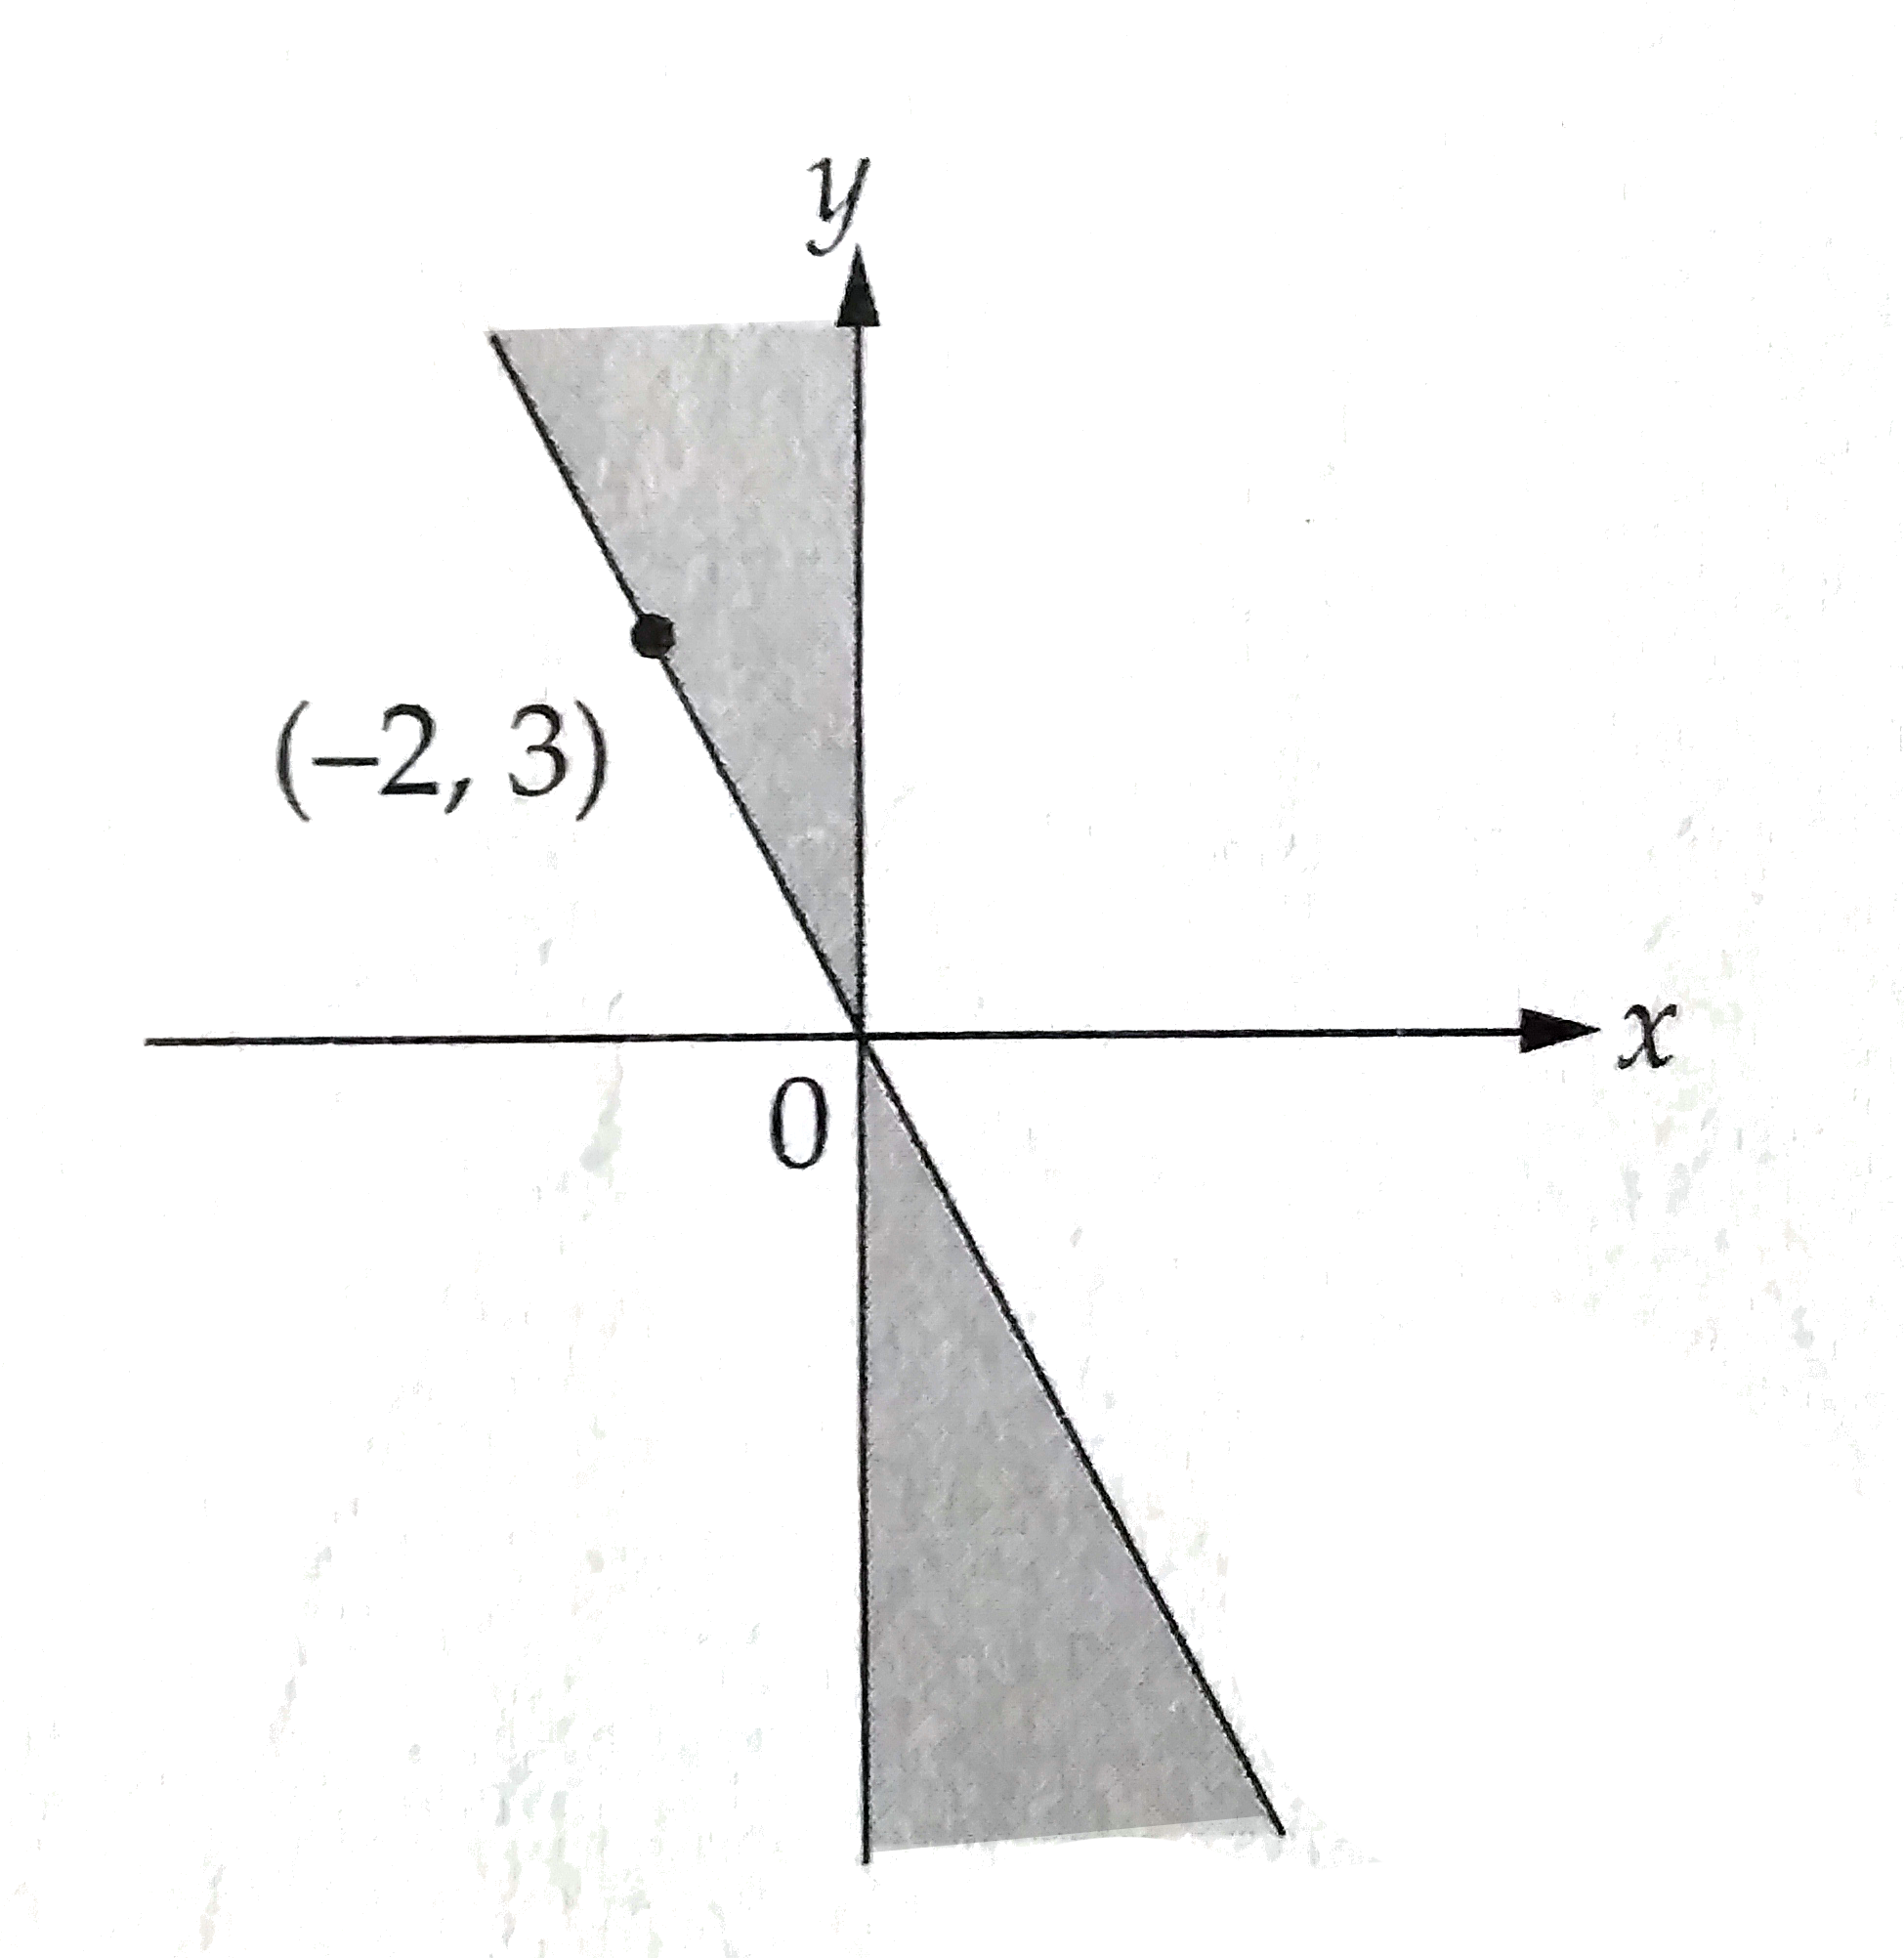
The figure shows the graph of which one of the following ?

y=2x−|x|
y=|x−1|+x
y=|2x−1|
y=|x+1|−x
The correct Answer is:B
Since the point where a major change takes place is at (1,1), the expression in the absolute value should equal zero when x = 1. This occurs only in Choice B. Check your answer by graphing the function in B on your graphing calculator.
Topper's Solved these Questions
- PIECEWISE FUNCTIONSBOOK - ENGLISH SATCHAPTER - PIECEWISE FUNCTIONSEXERCISE - EXERCISES
8 Videos
- PASSPORT TO ADVANCED MATHBOOK - ENGLISH SATCHAPTER - PASSPORT TO ADVANCED MATHEXERCISE - EXERCISE
80 Videos
- PLANE GEOMETRY/ TRIGONOMETRYBOOK - ENGLISH SATCHAPTER - PLANE GEOMETRY/ TRIGONOMETRYEXERCISE - EXERCISE
12 Videos
Similar Questions
Knowledge Check
The shaded portion of figure shows the graph of which of the following ?
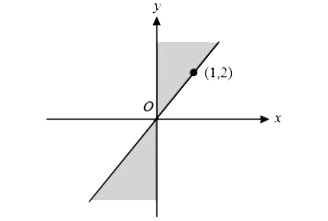 Ax(y−2x)≥0Bx(y−2x)≤0Cx(y+12x)≥0Dx(y−12x)≤0
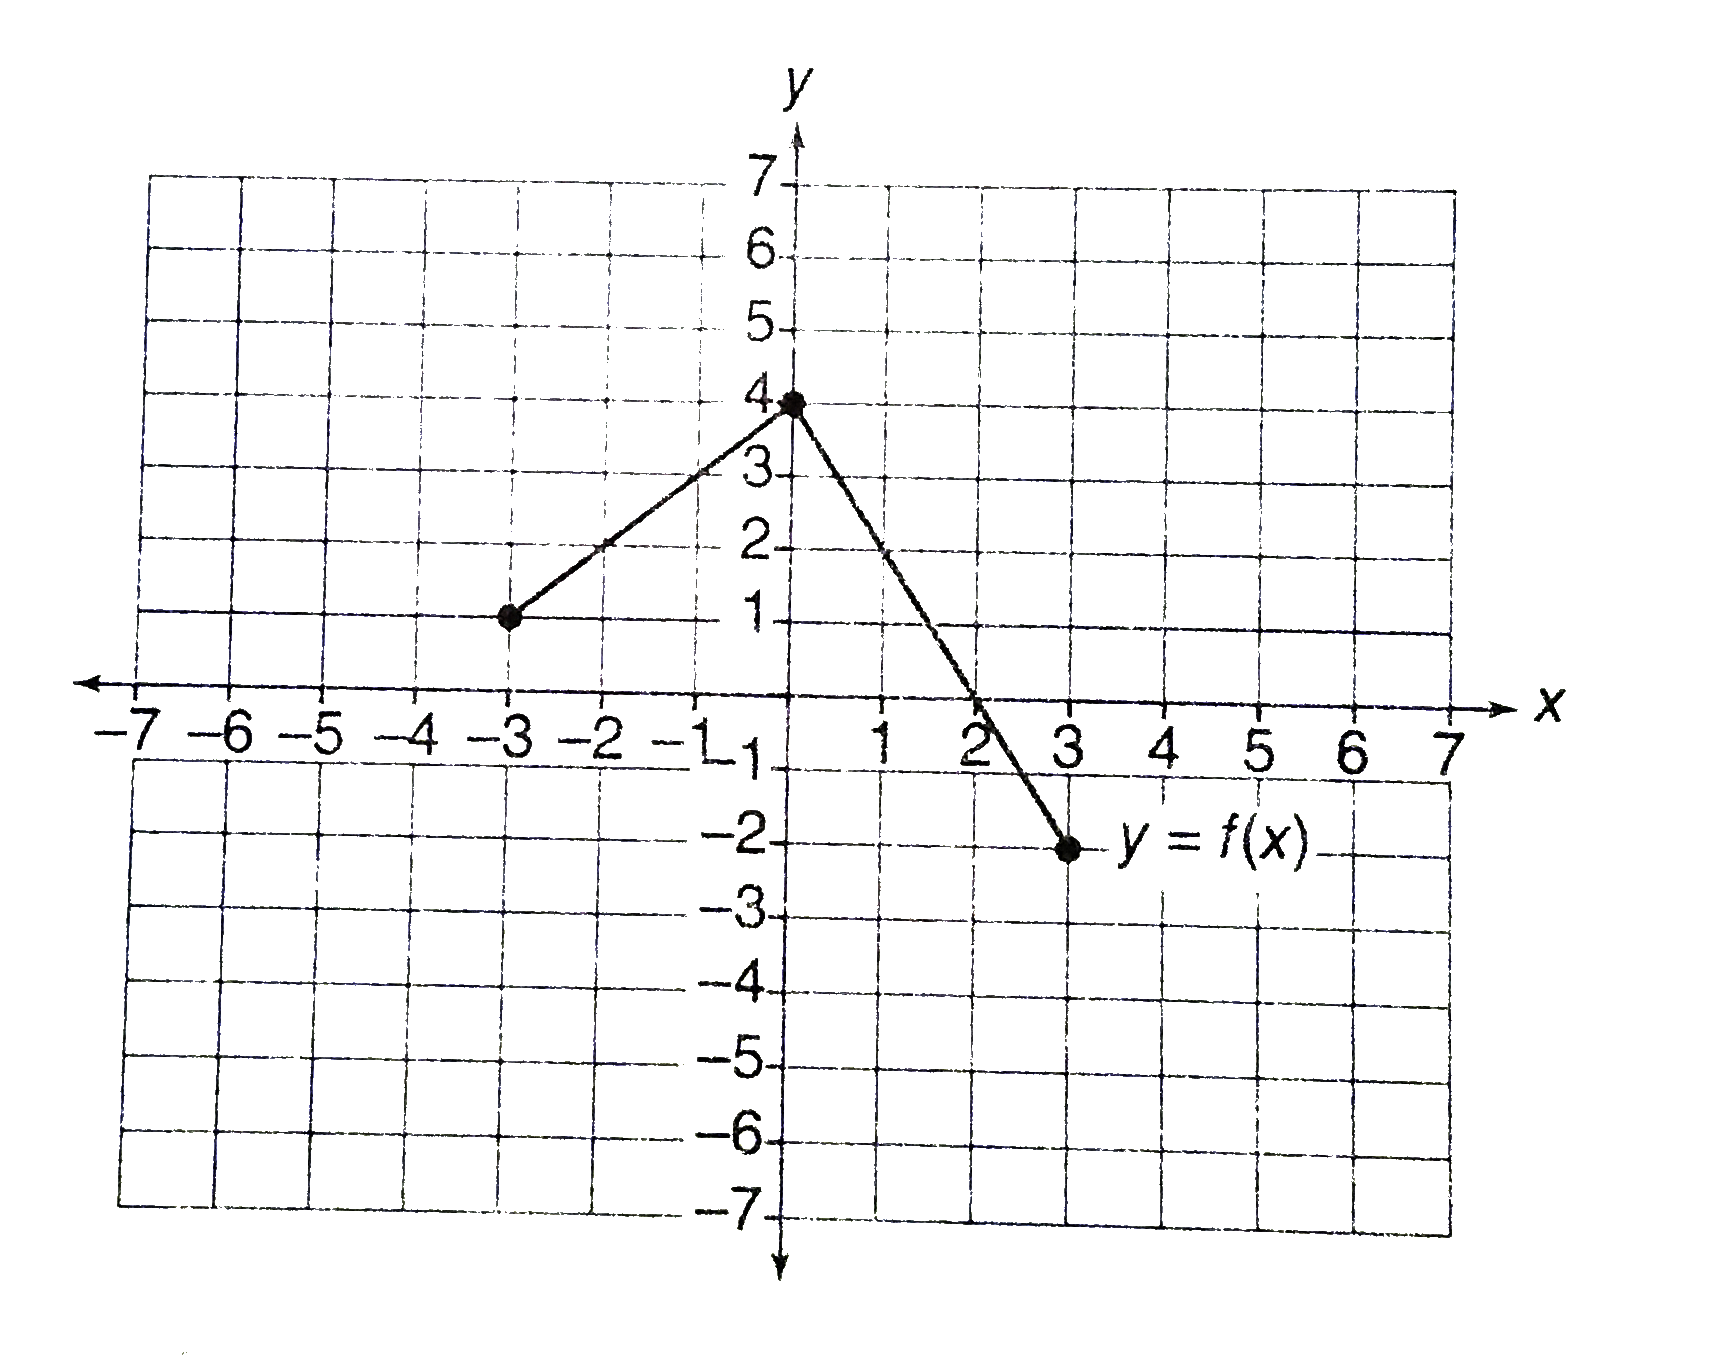
If the accomanying figure above shows the graph of function f, which of the following could represent the graph of y=f(x+1)?A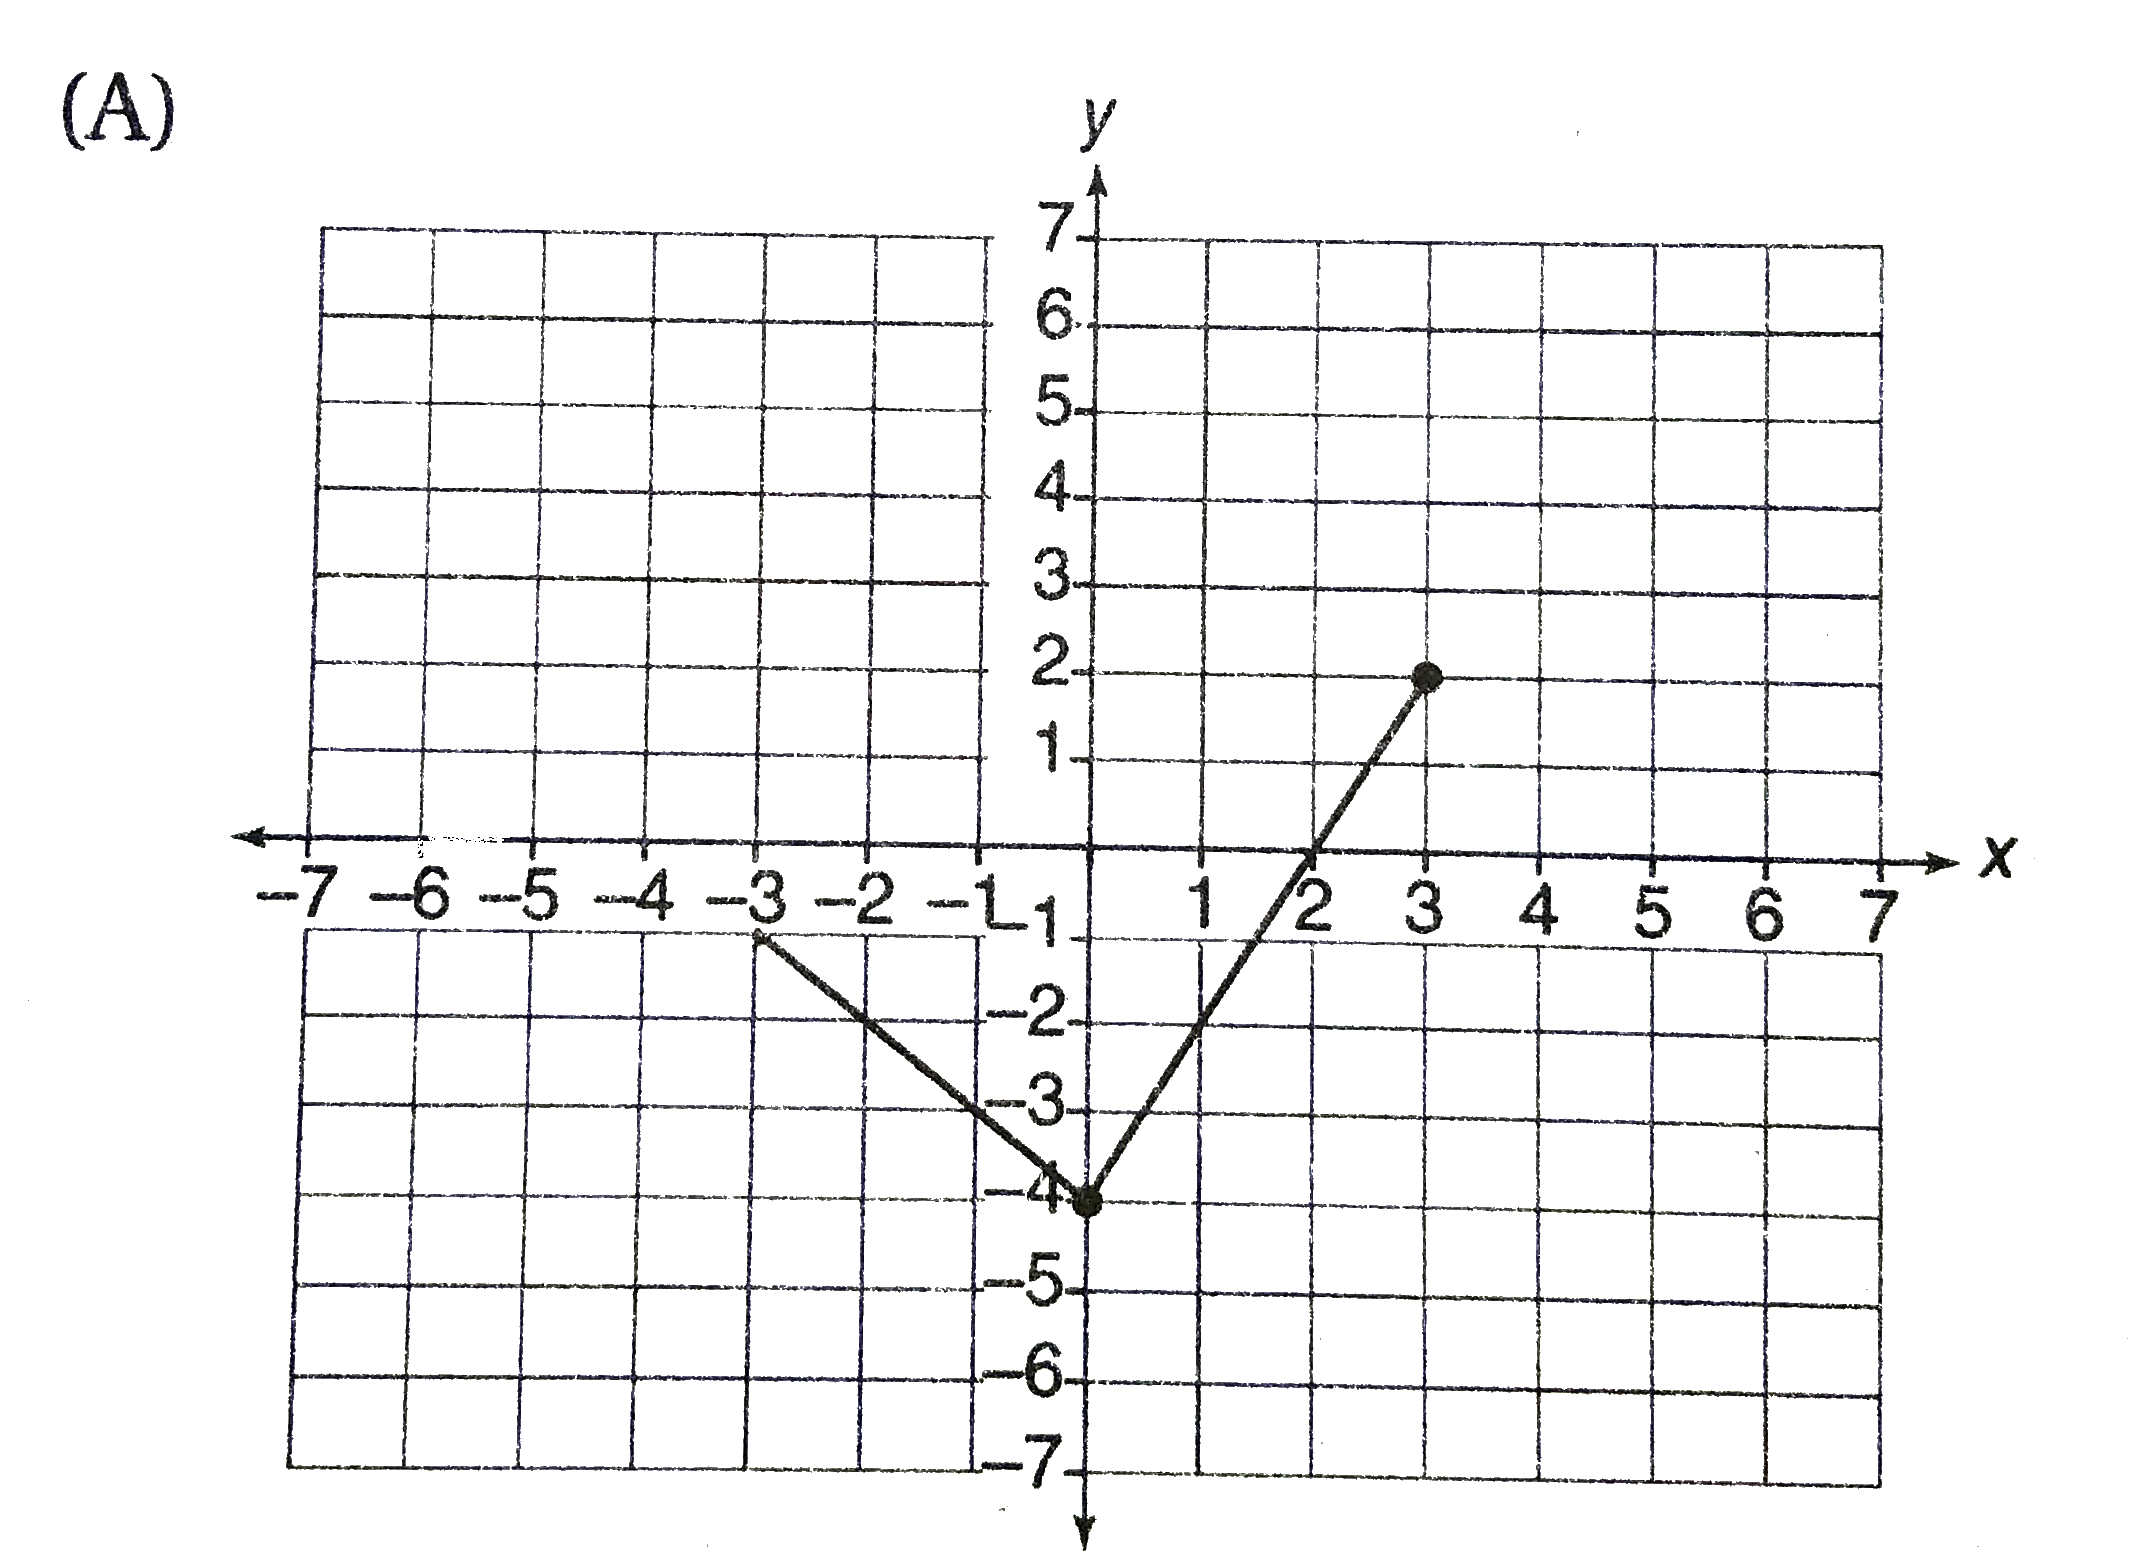 B
B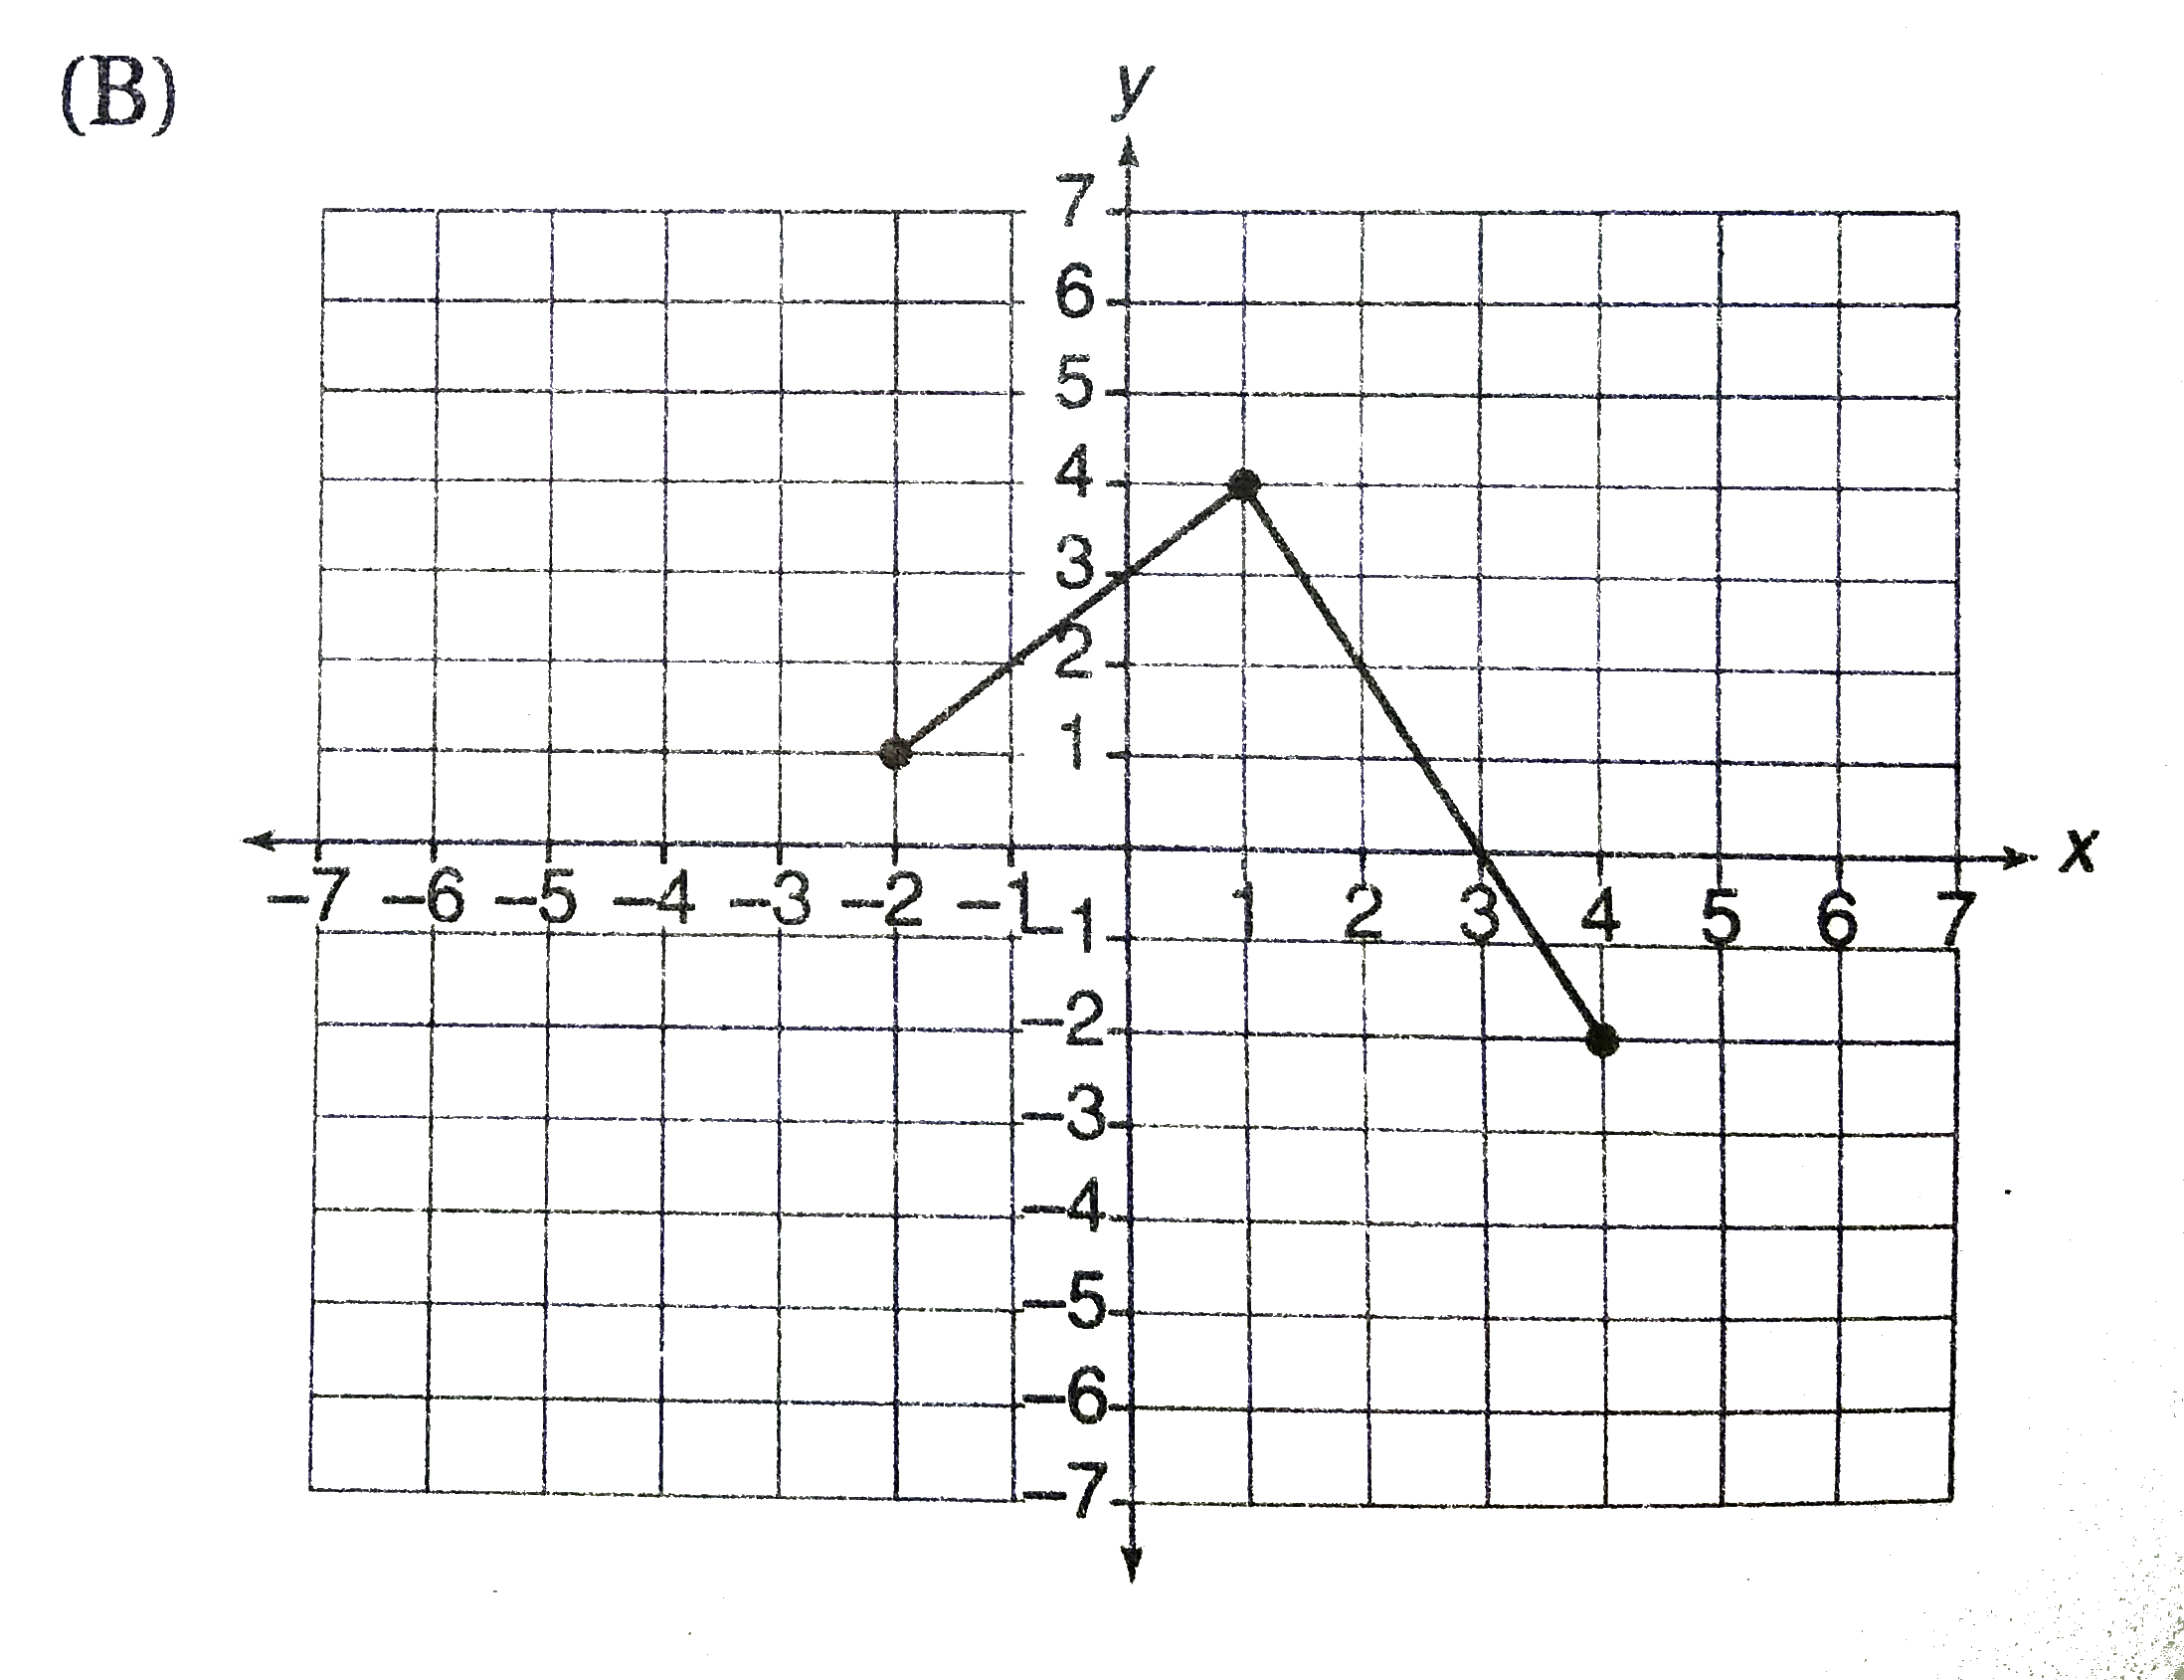 C
C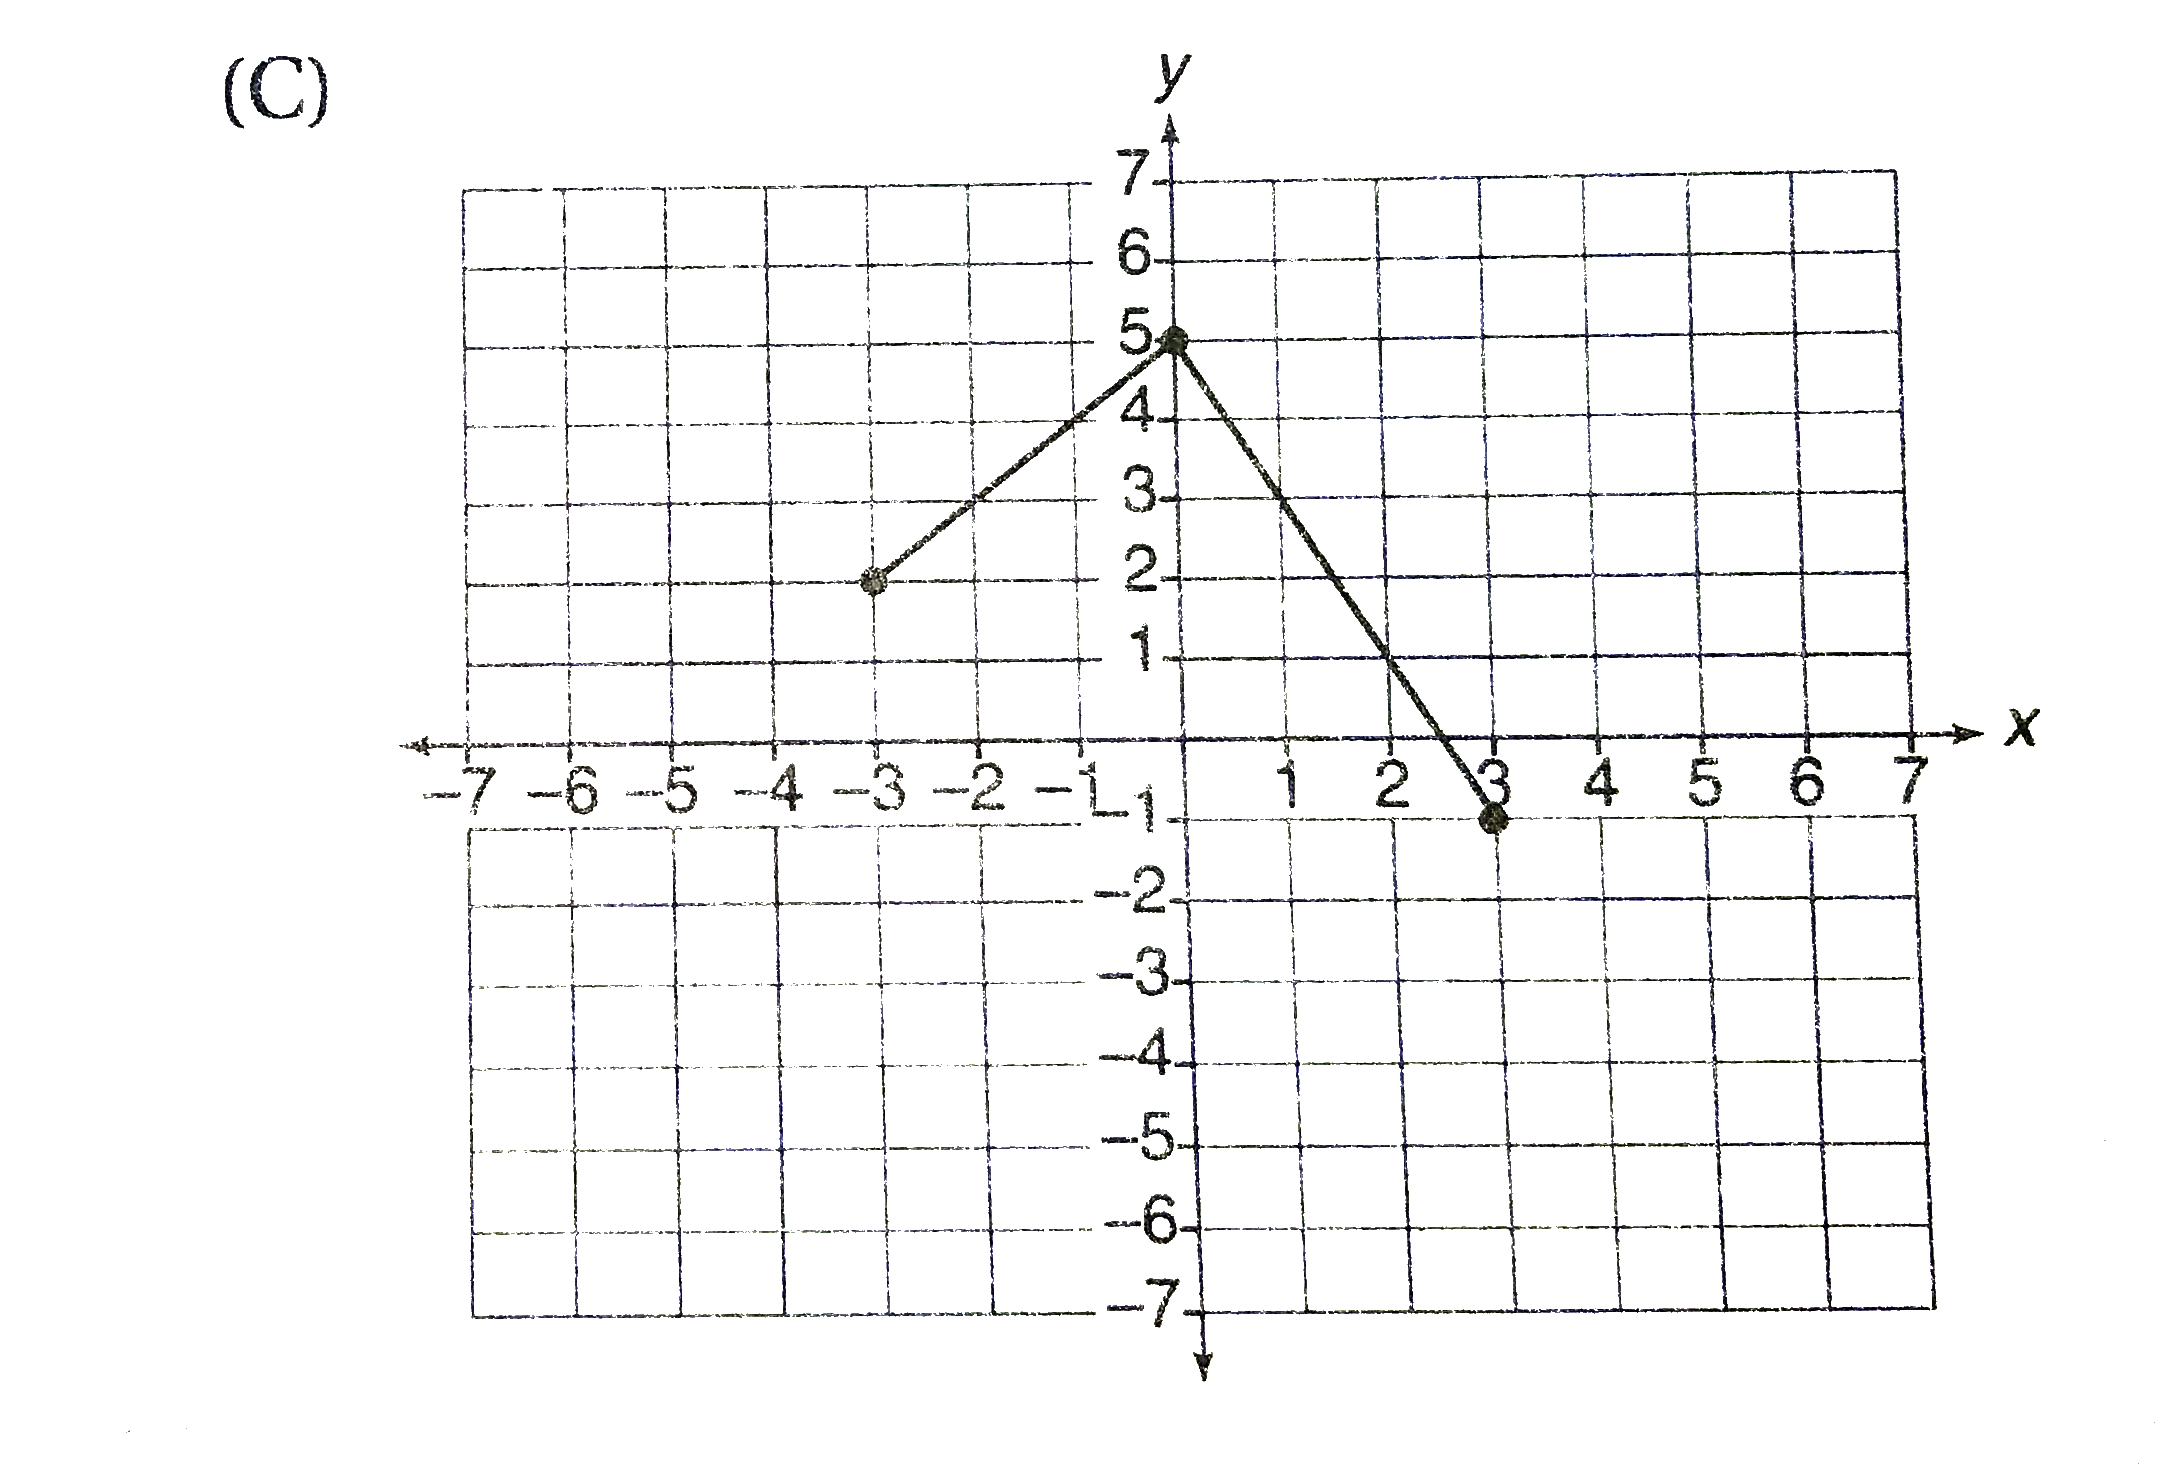 D
D
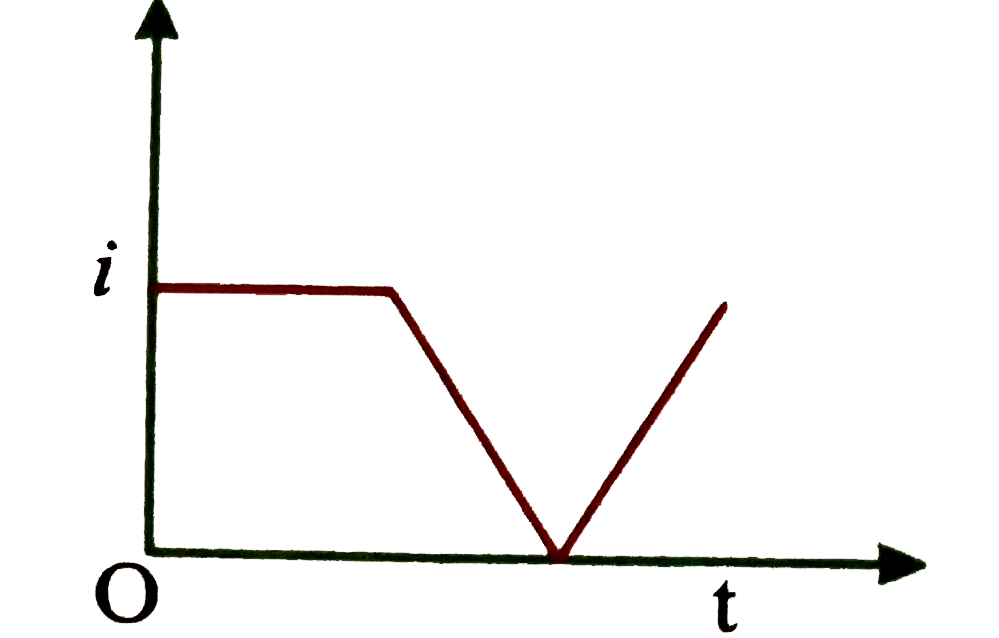
The current I in an inductance coil varies with time according to the graph given in the figure.
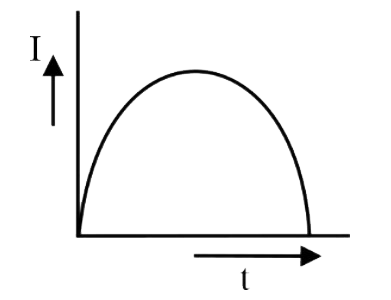
Which one of the following graphs gives the variation of voltage with time across the inductor?A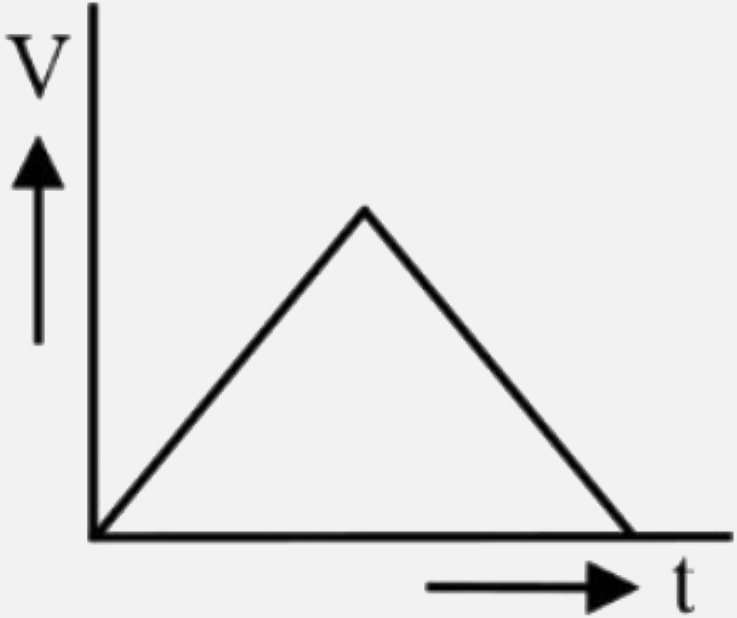 B
B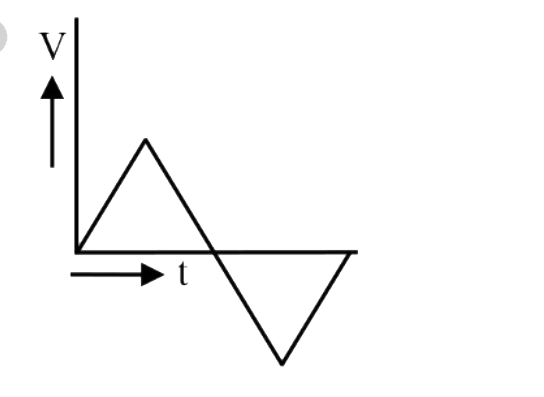 C
C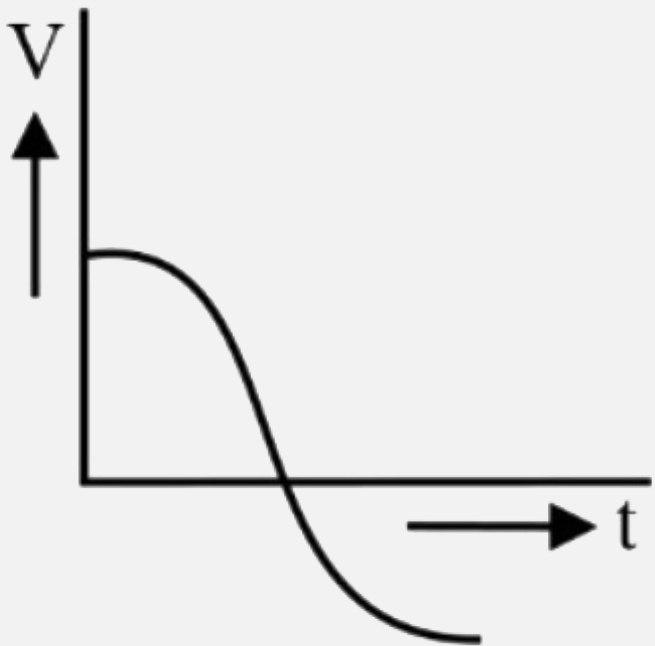 D
D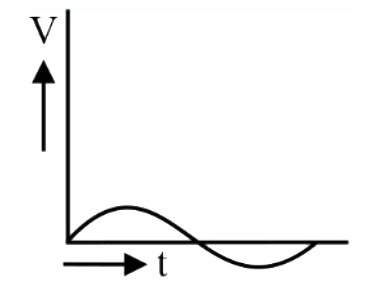
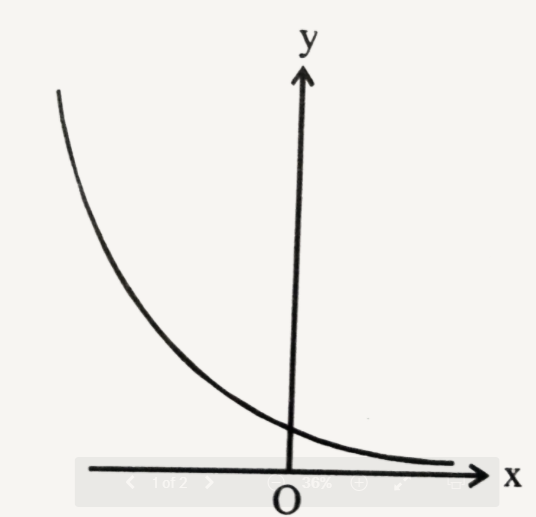
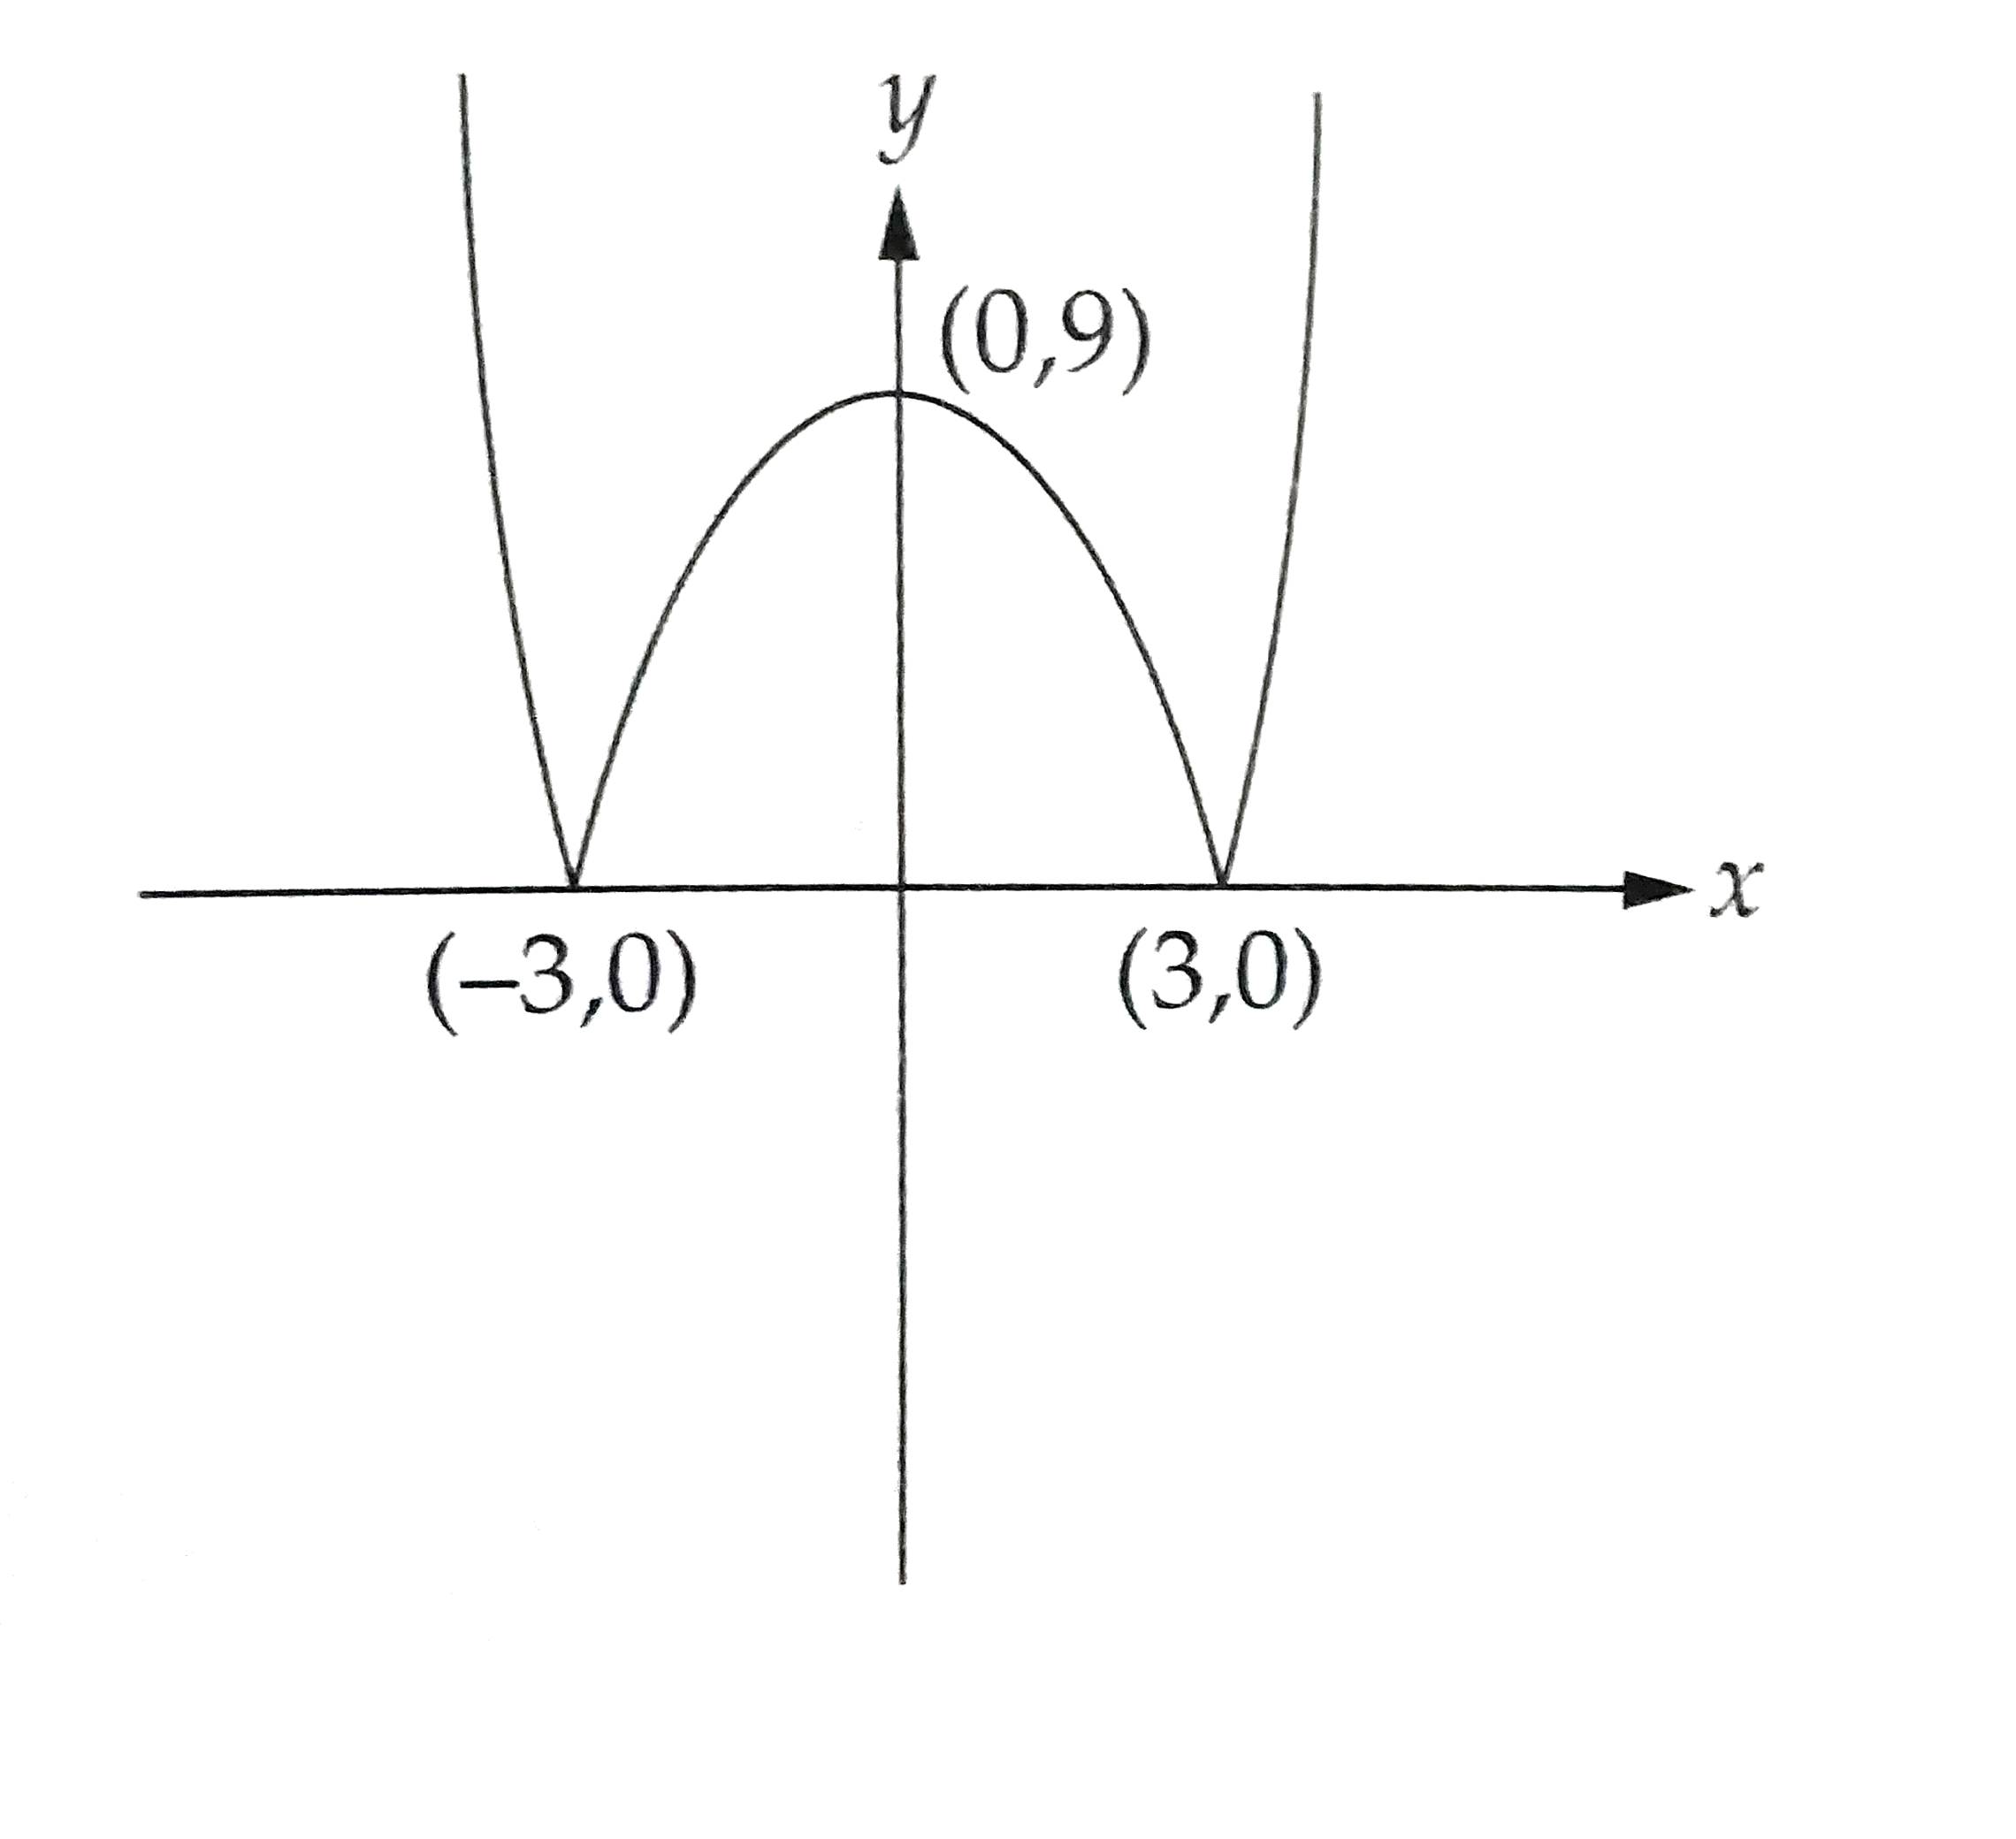
The above curve shows the graph of ax under which one of the following conditions ?
View SolutionThe displacement-time graph of a particle executing simple harmonic motion is shown in the figure
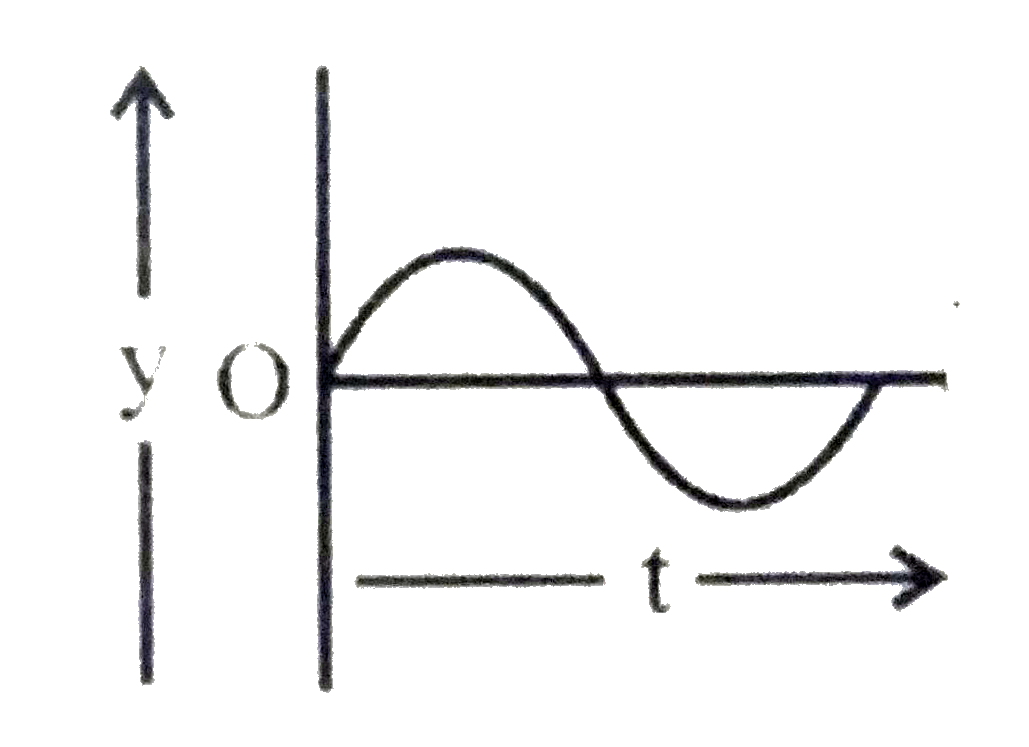
Which one of the following graphs is the correct forcetime graph for the motion of the particle ?
View SolutionThe current I in an inductance coil varies with time according to the graph given in the figure.

Which one of the following graphs gives the variation of voltage with time across the inductor?
View SolutionThe current i in an induction coil varies with time according to the graph shown in figure. Which of the following graph shows induced emf in the coil with time:
View SolutionThe current is an induction coil varies with time t, according to the graph shown in figure. Which of the following graphs shows the induced emf (e) in the coil with time.
View Solution

