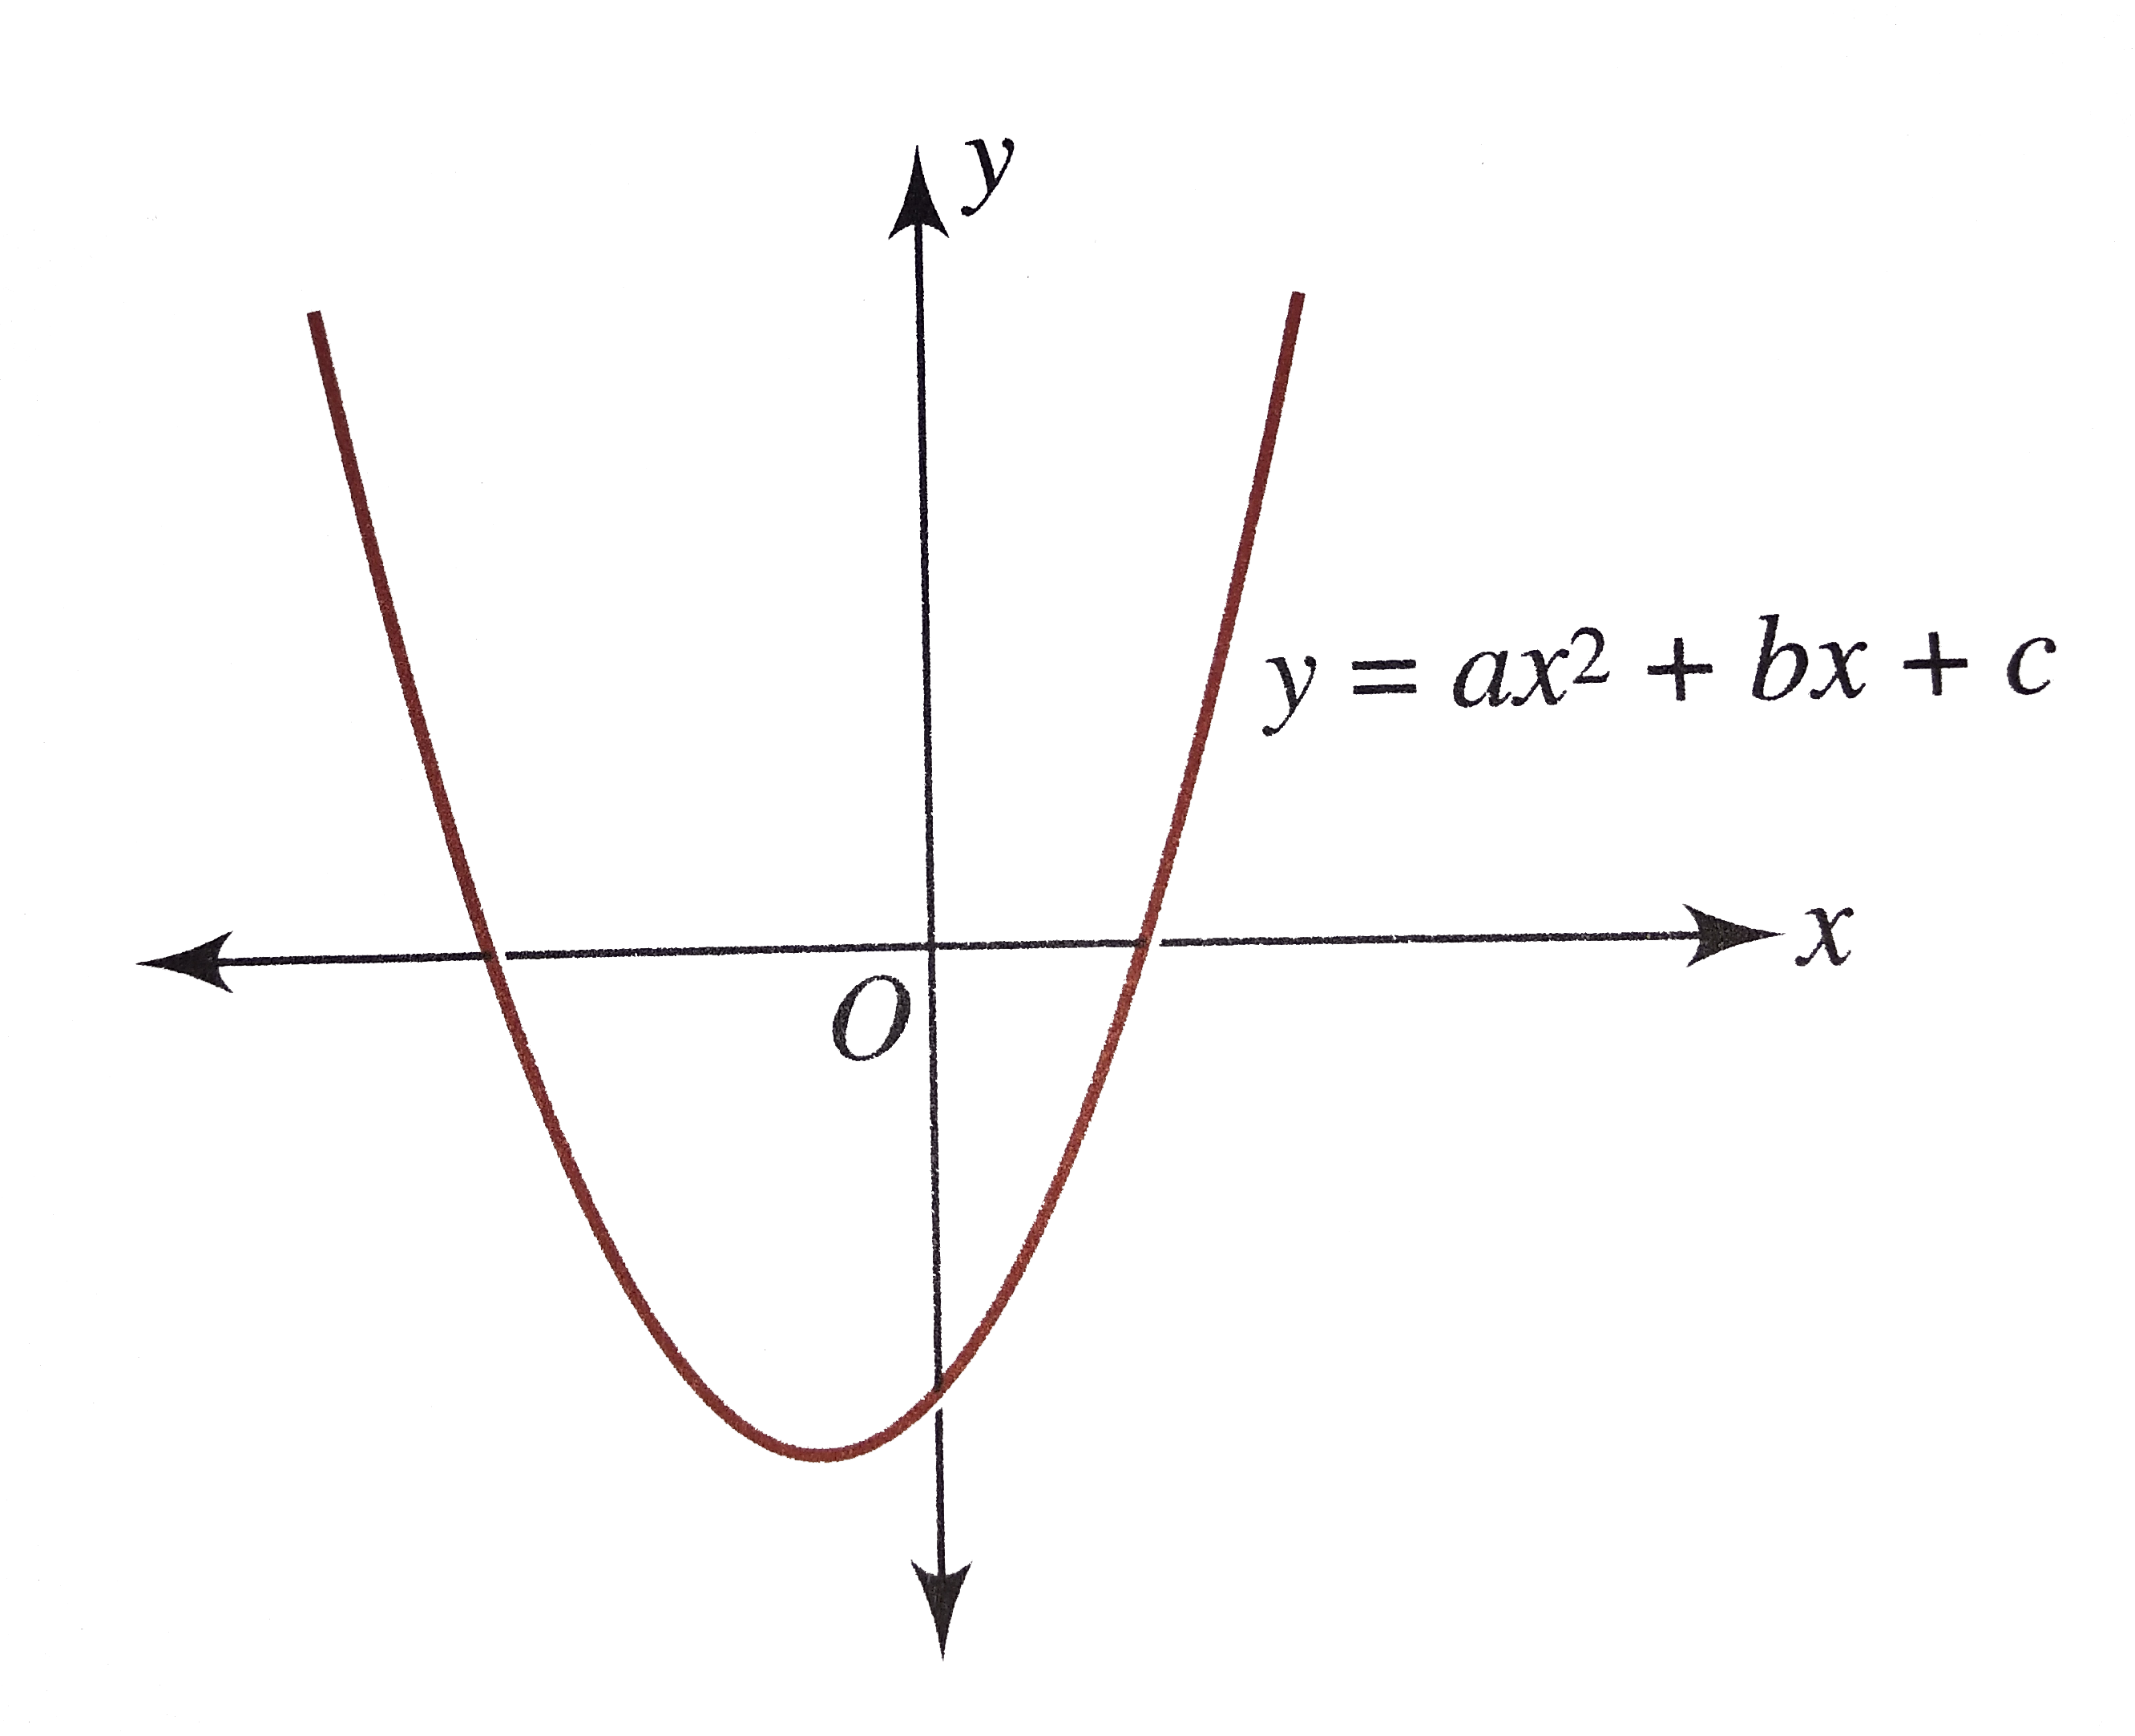
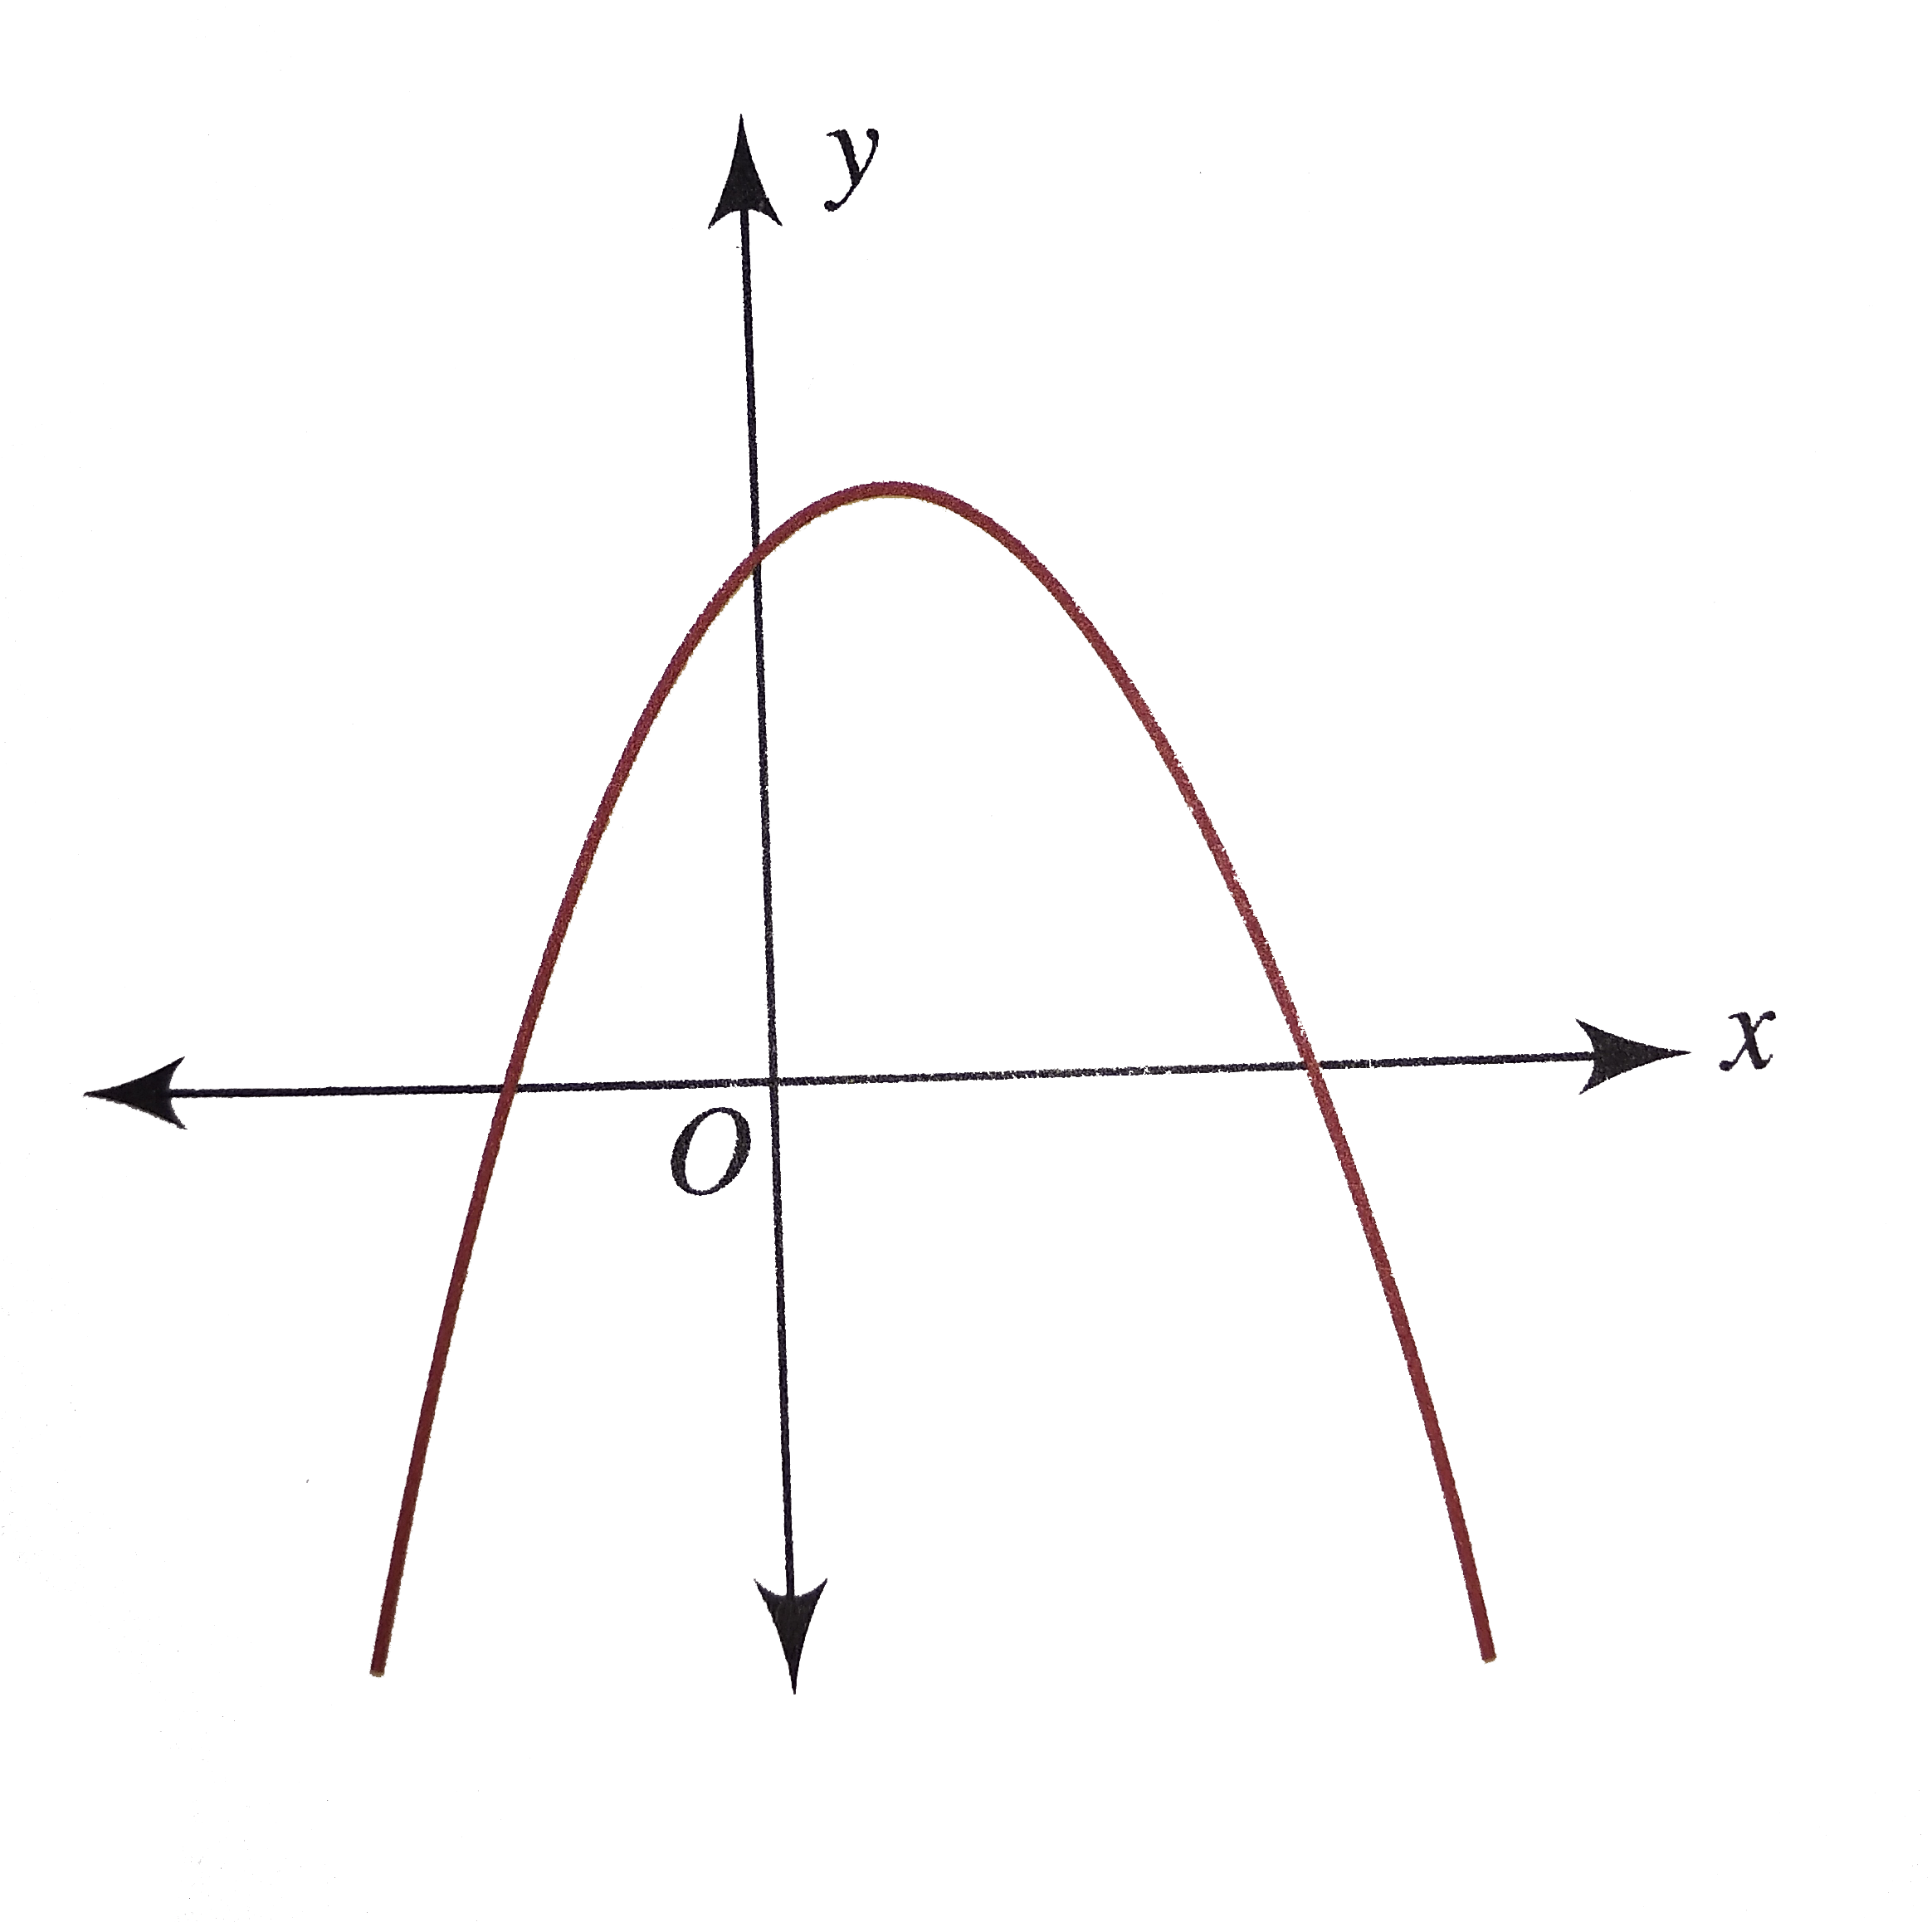
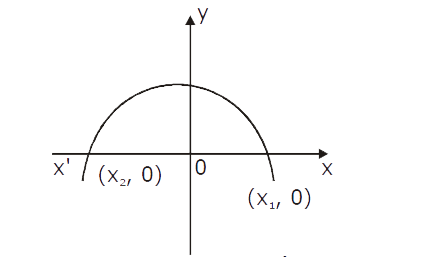
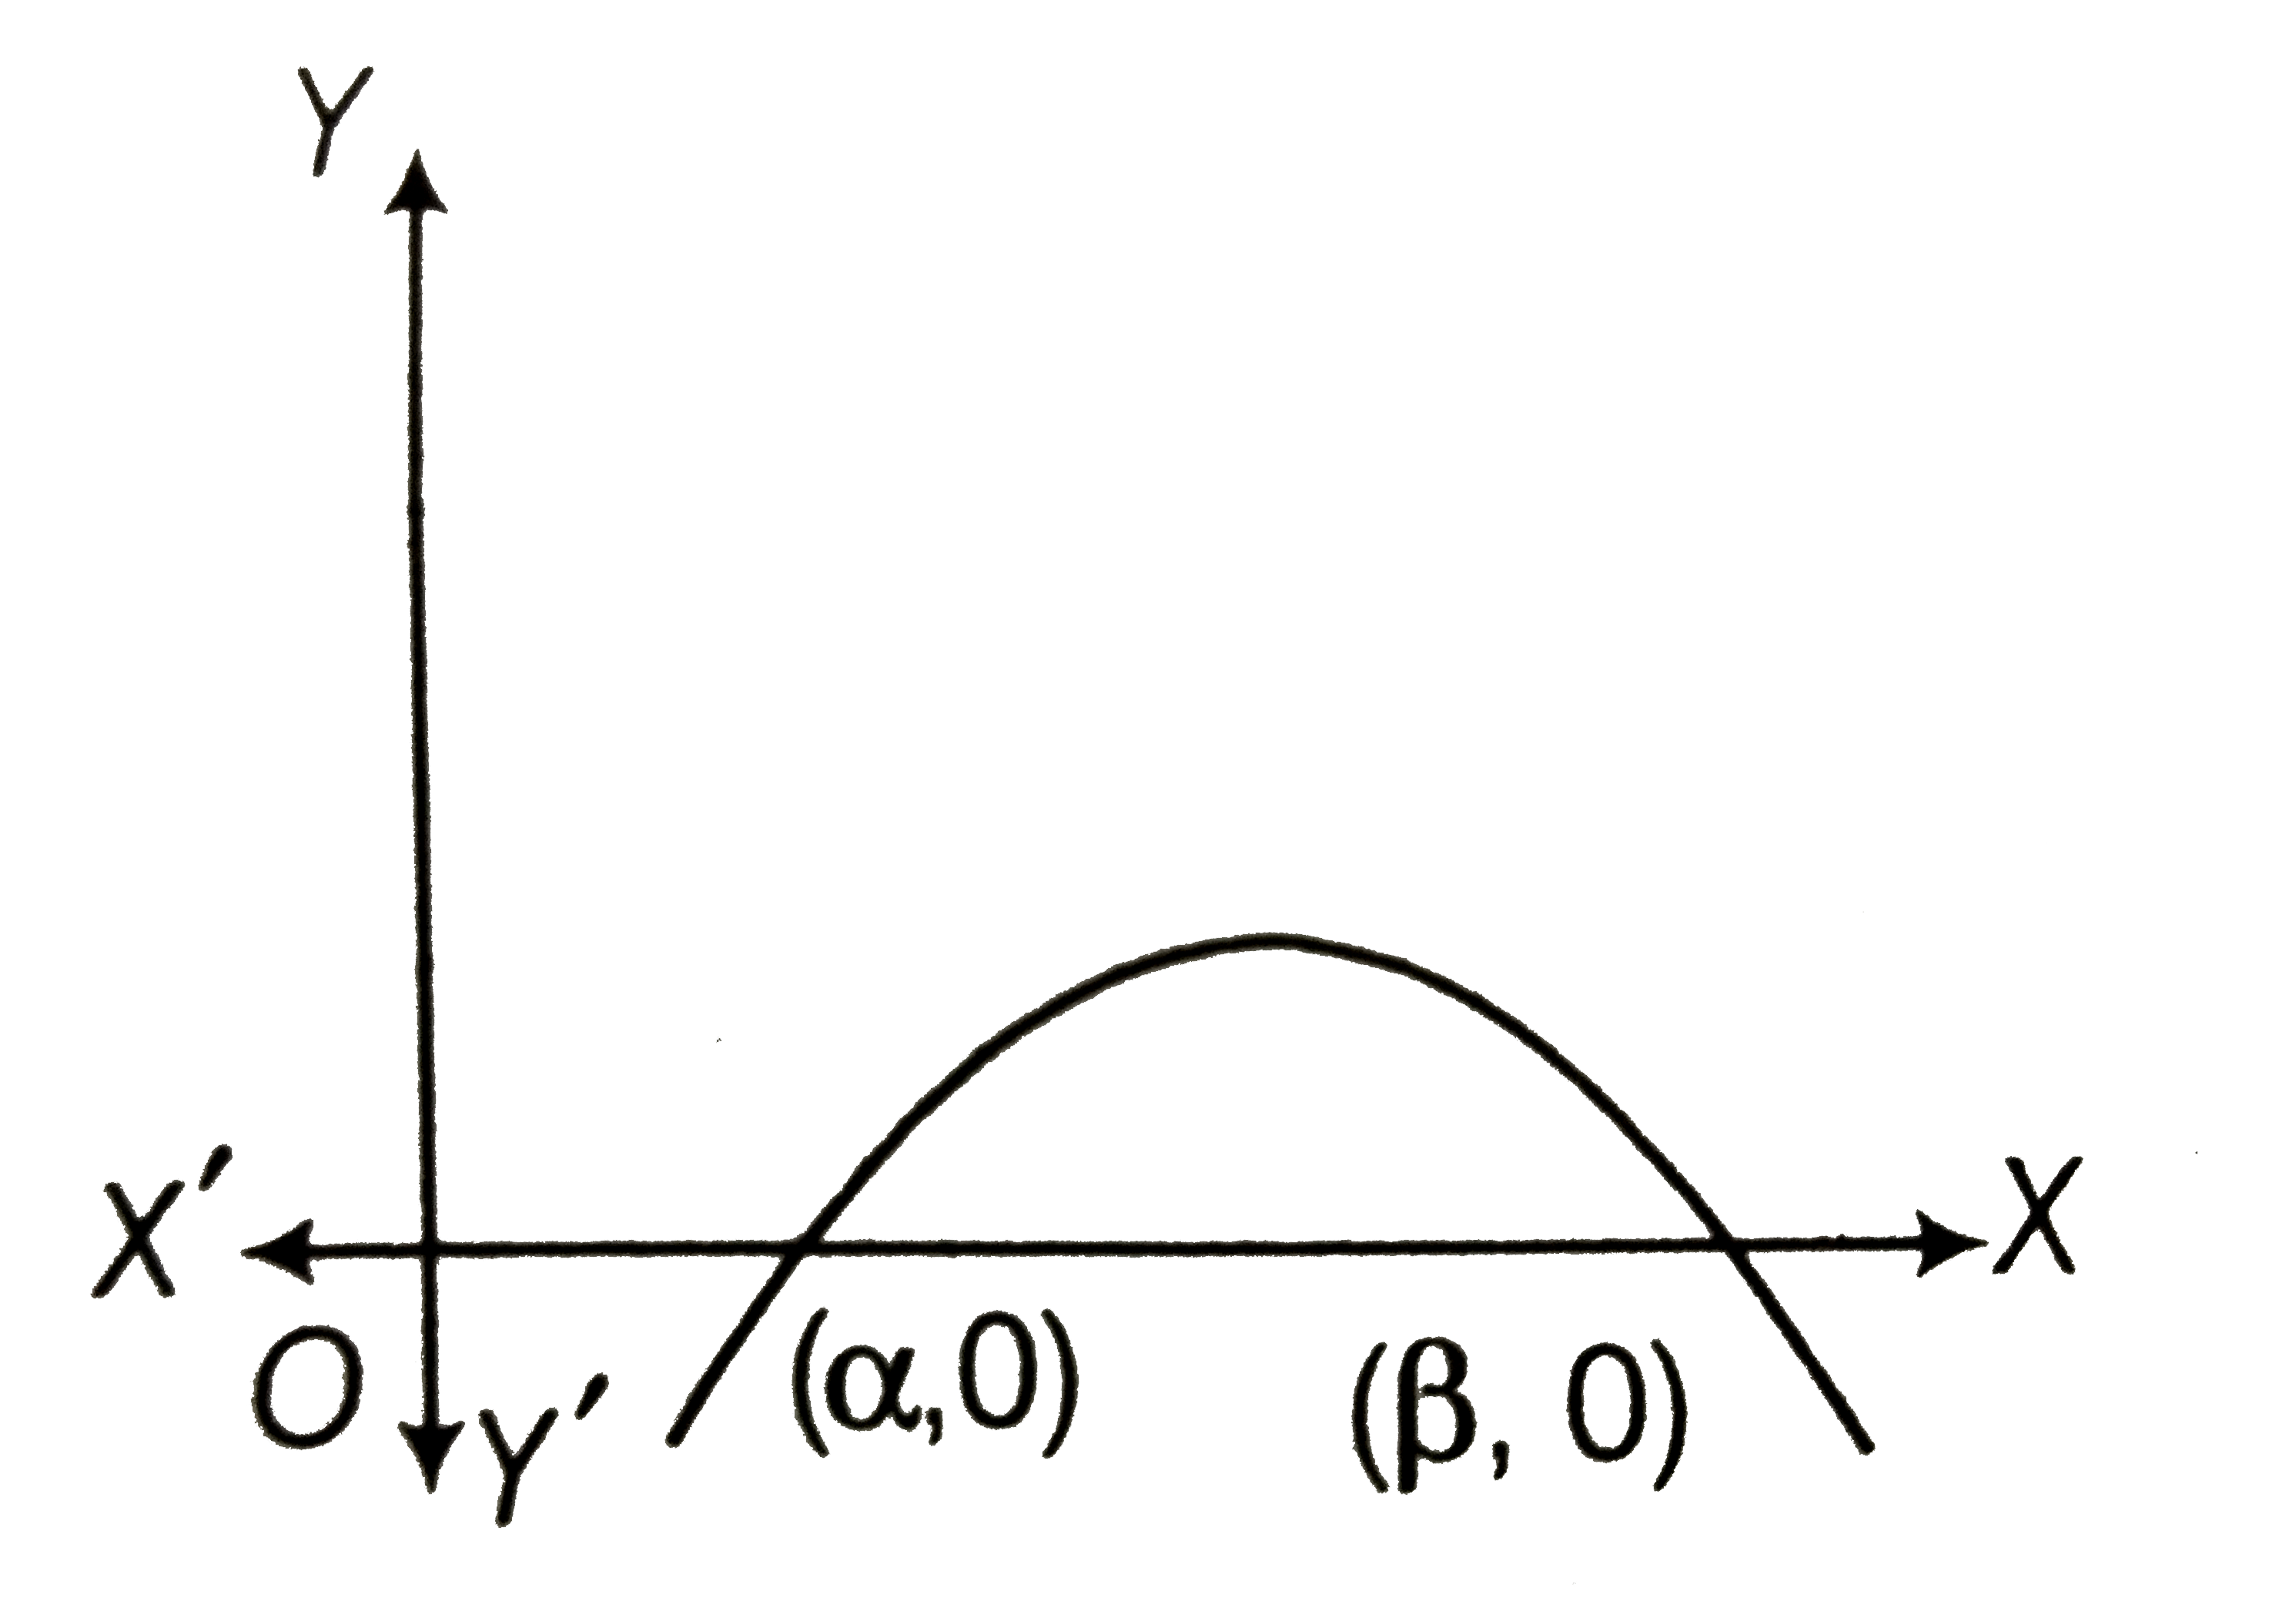
The adjoining figure shows the graph of y=ax2+bx+c . Then
Step by step video & image solution for The adjoining figure shows the graph of y = ax^2 + bx + c . Then by Maths experts to help you in doubts & scoring excellent marks in Class 11 exams.
Updated on:21/07/2023সম্পর্কিত প্রশ্ন
The following figure shows the graph of f(x)=ax2+bx+c, then find the sign of values of a,bandc.

View SolutionThe following figure shows the graph of f(x)=ax2+bx+c, then find the sign of values of a,bandc.

View SolutionThe following figure shows the graph of f(x)=ax2+bx+c, find the sign of a,bandc.

View SolutionThe following figure shows the graph of f(x)=ax2+bx+c, find the signs of a,bandc.

View SolutionThe diagram shows the grap of y=ax2+bx+c. Then

View SolutionFocus of parabola y = ax2+bx+c is
View SolutionFigure 2.23 show the graph of the polynomial f(x) = ax² + bx + c for which (a) a < 0, b > 0 and c > 0 (b) a < 0, b < 0 and c > 0 (c) a < 0, b < 0 and c < 0 (d) a > 0, b > 0 and c < 0
View SolutionThe adjoining graph of y=ax2+bx+c shows that

View SolutionThe adjoining graph of y=ax2+bx+c shows that

View SolutionIf fig shows the graph of f(x)=ax2+bx+c,then Fig ac<0 b. bc>0 c. ab>0 d. abc<0
View Solution
