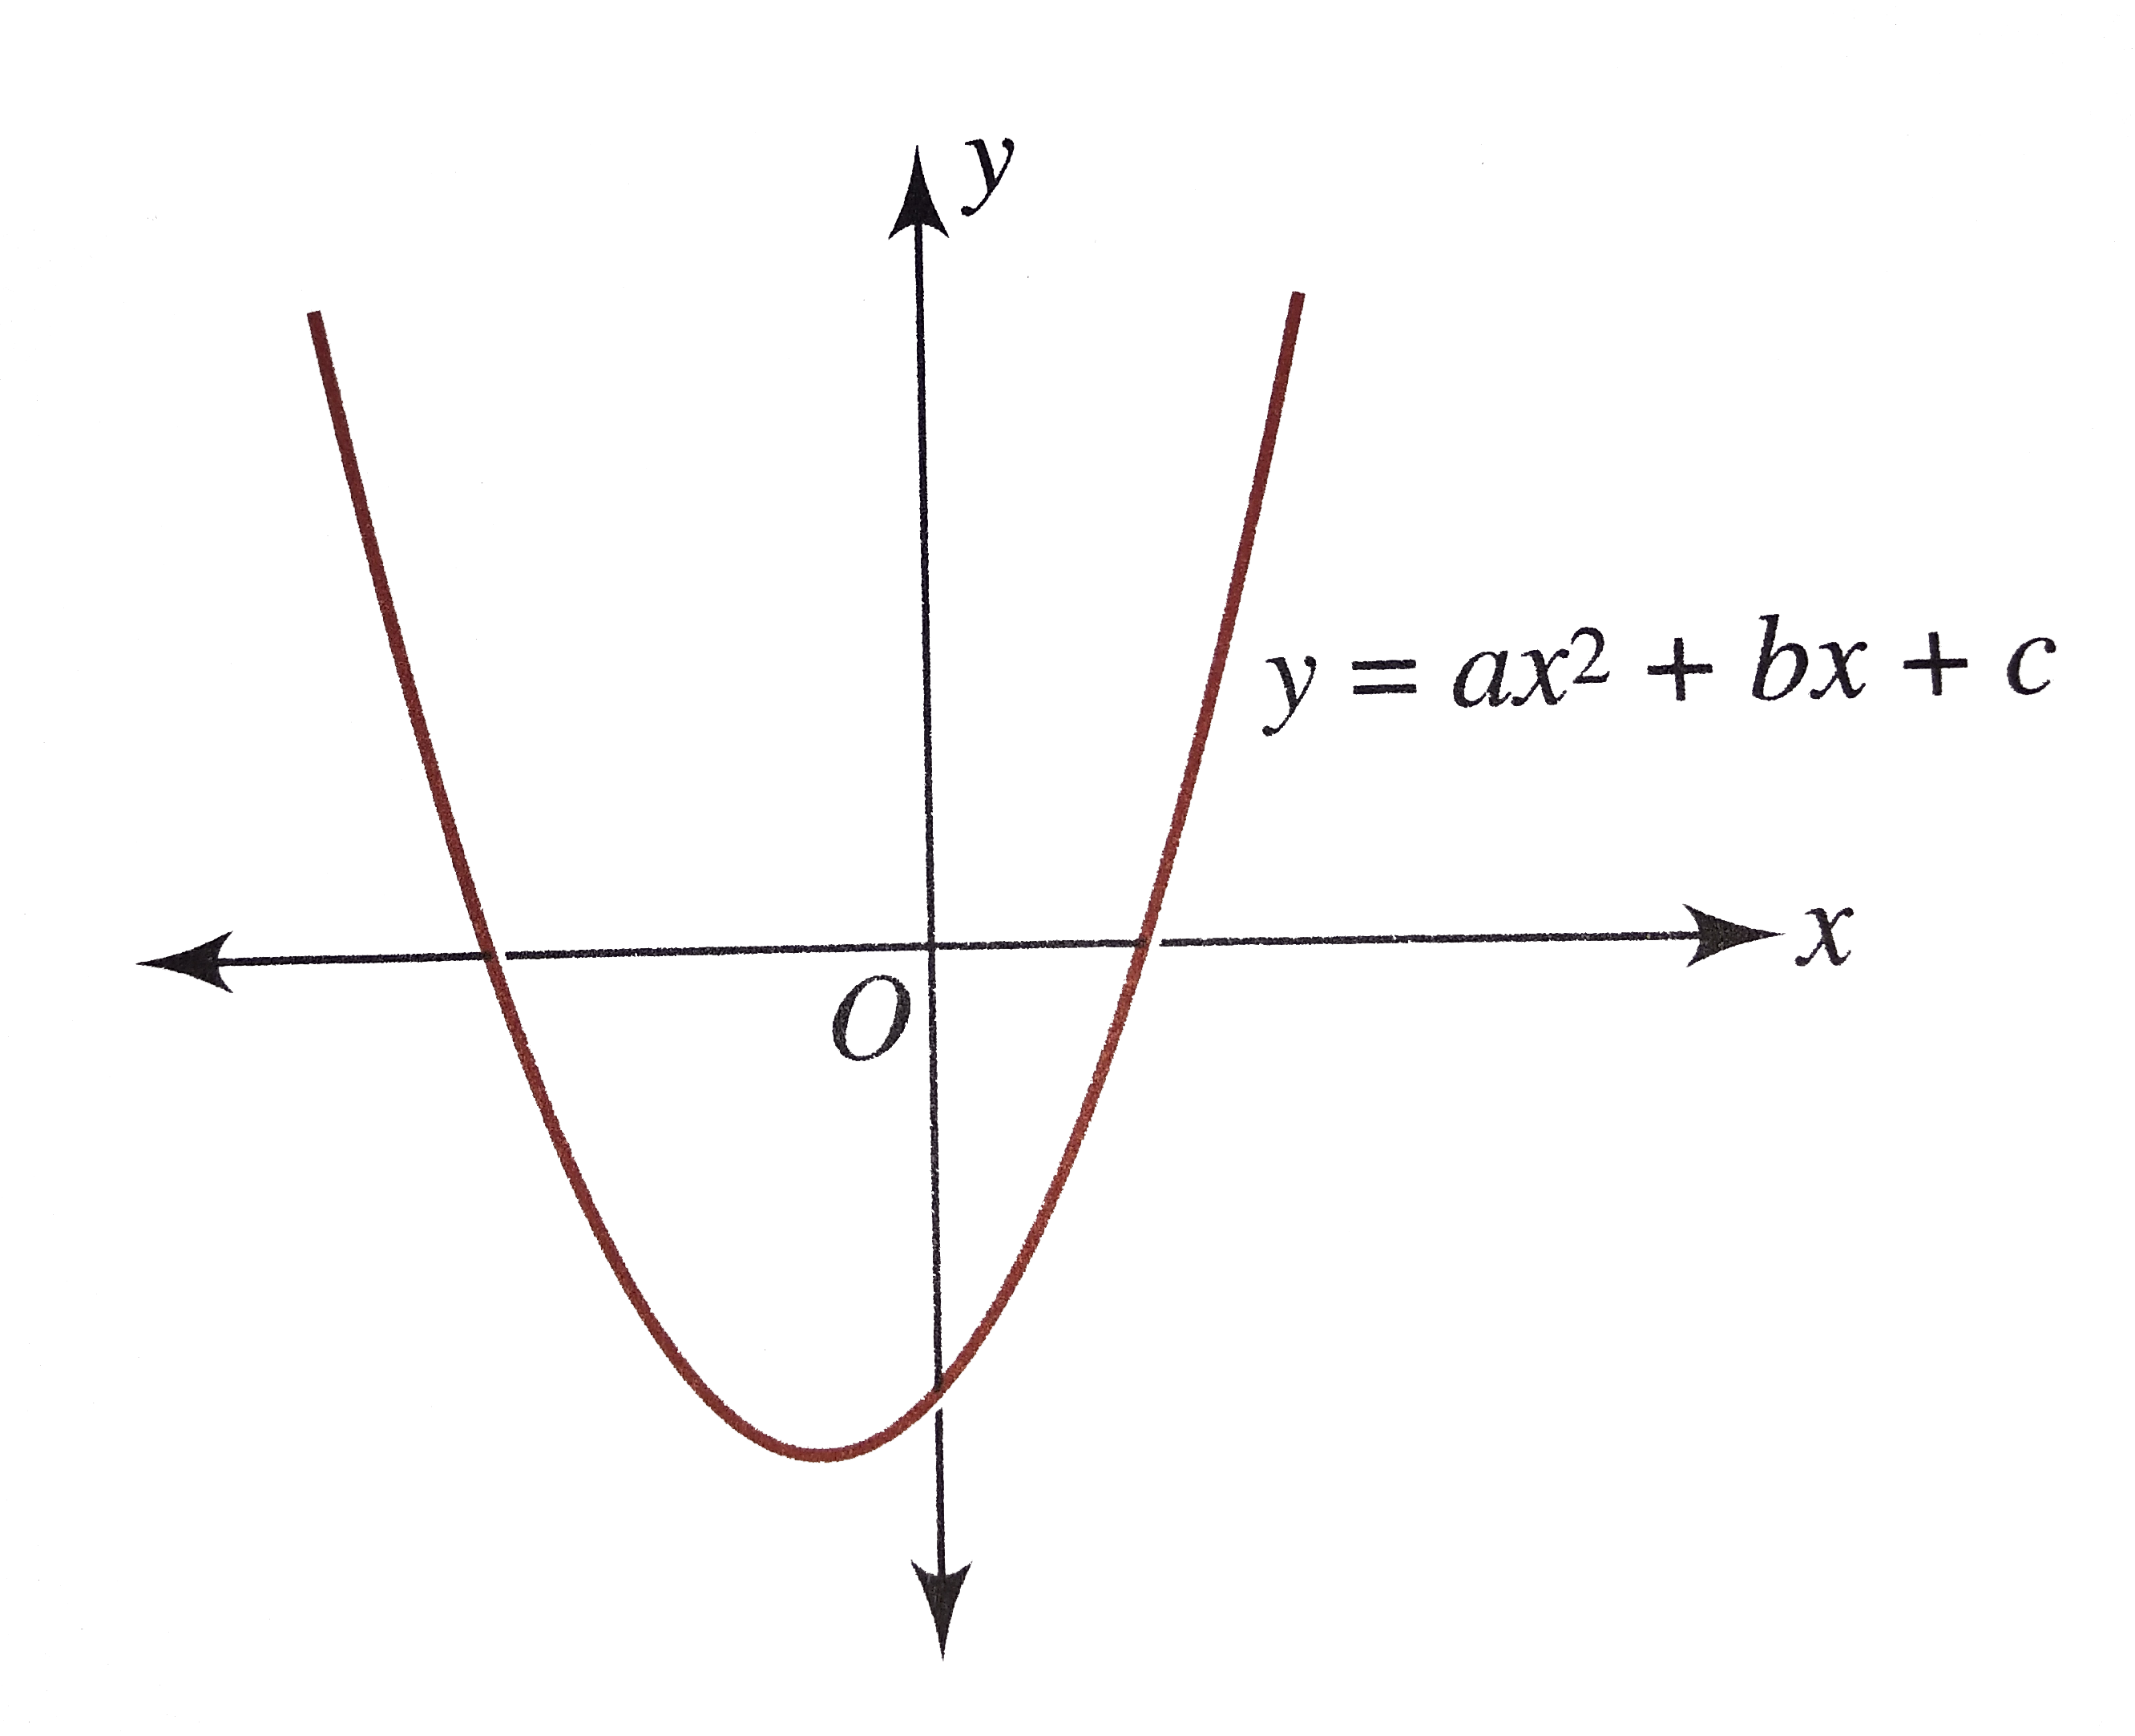
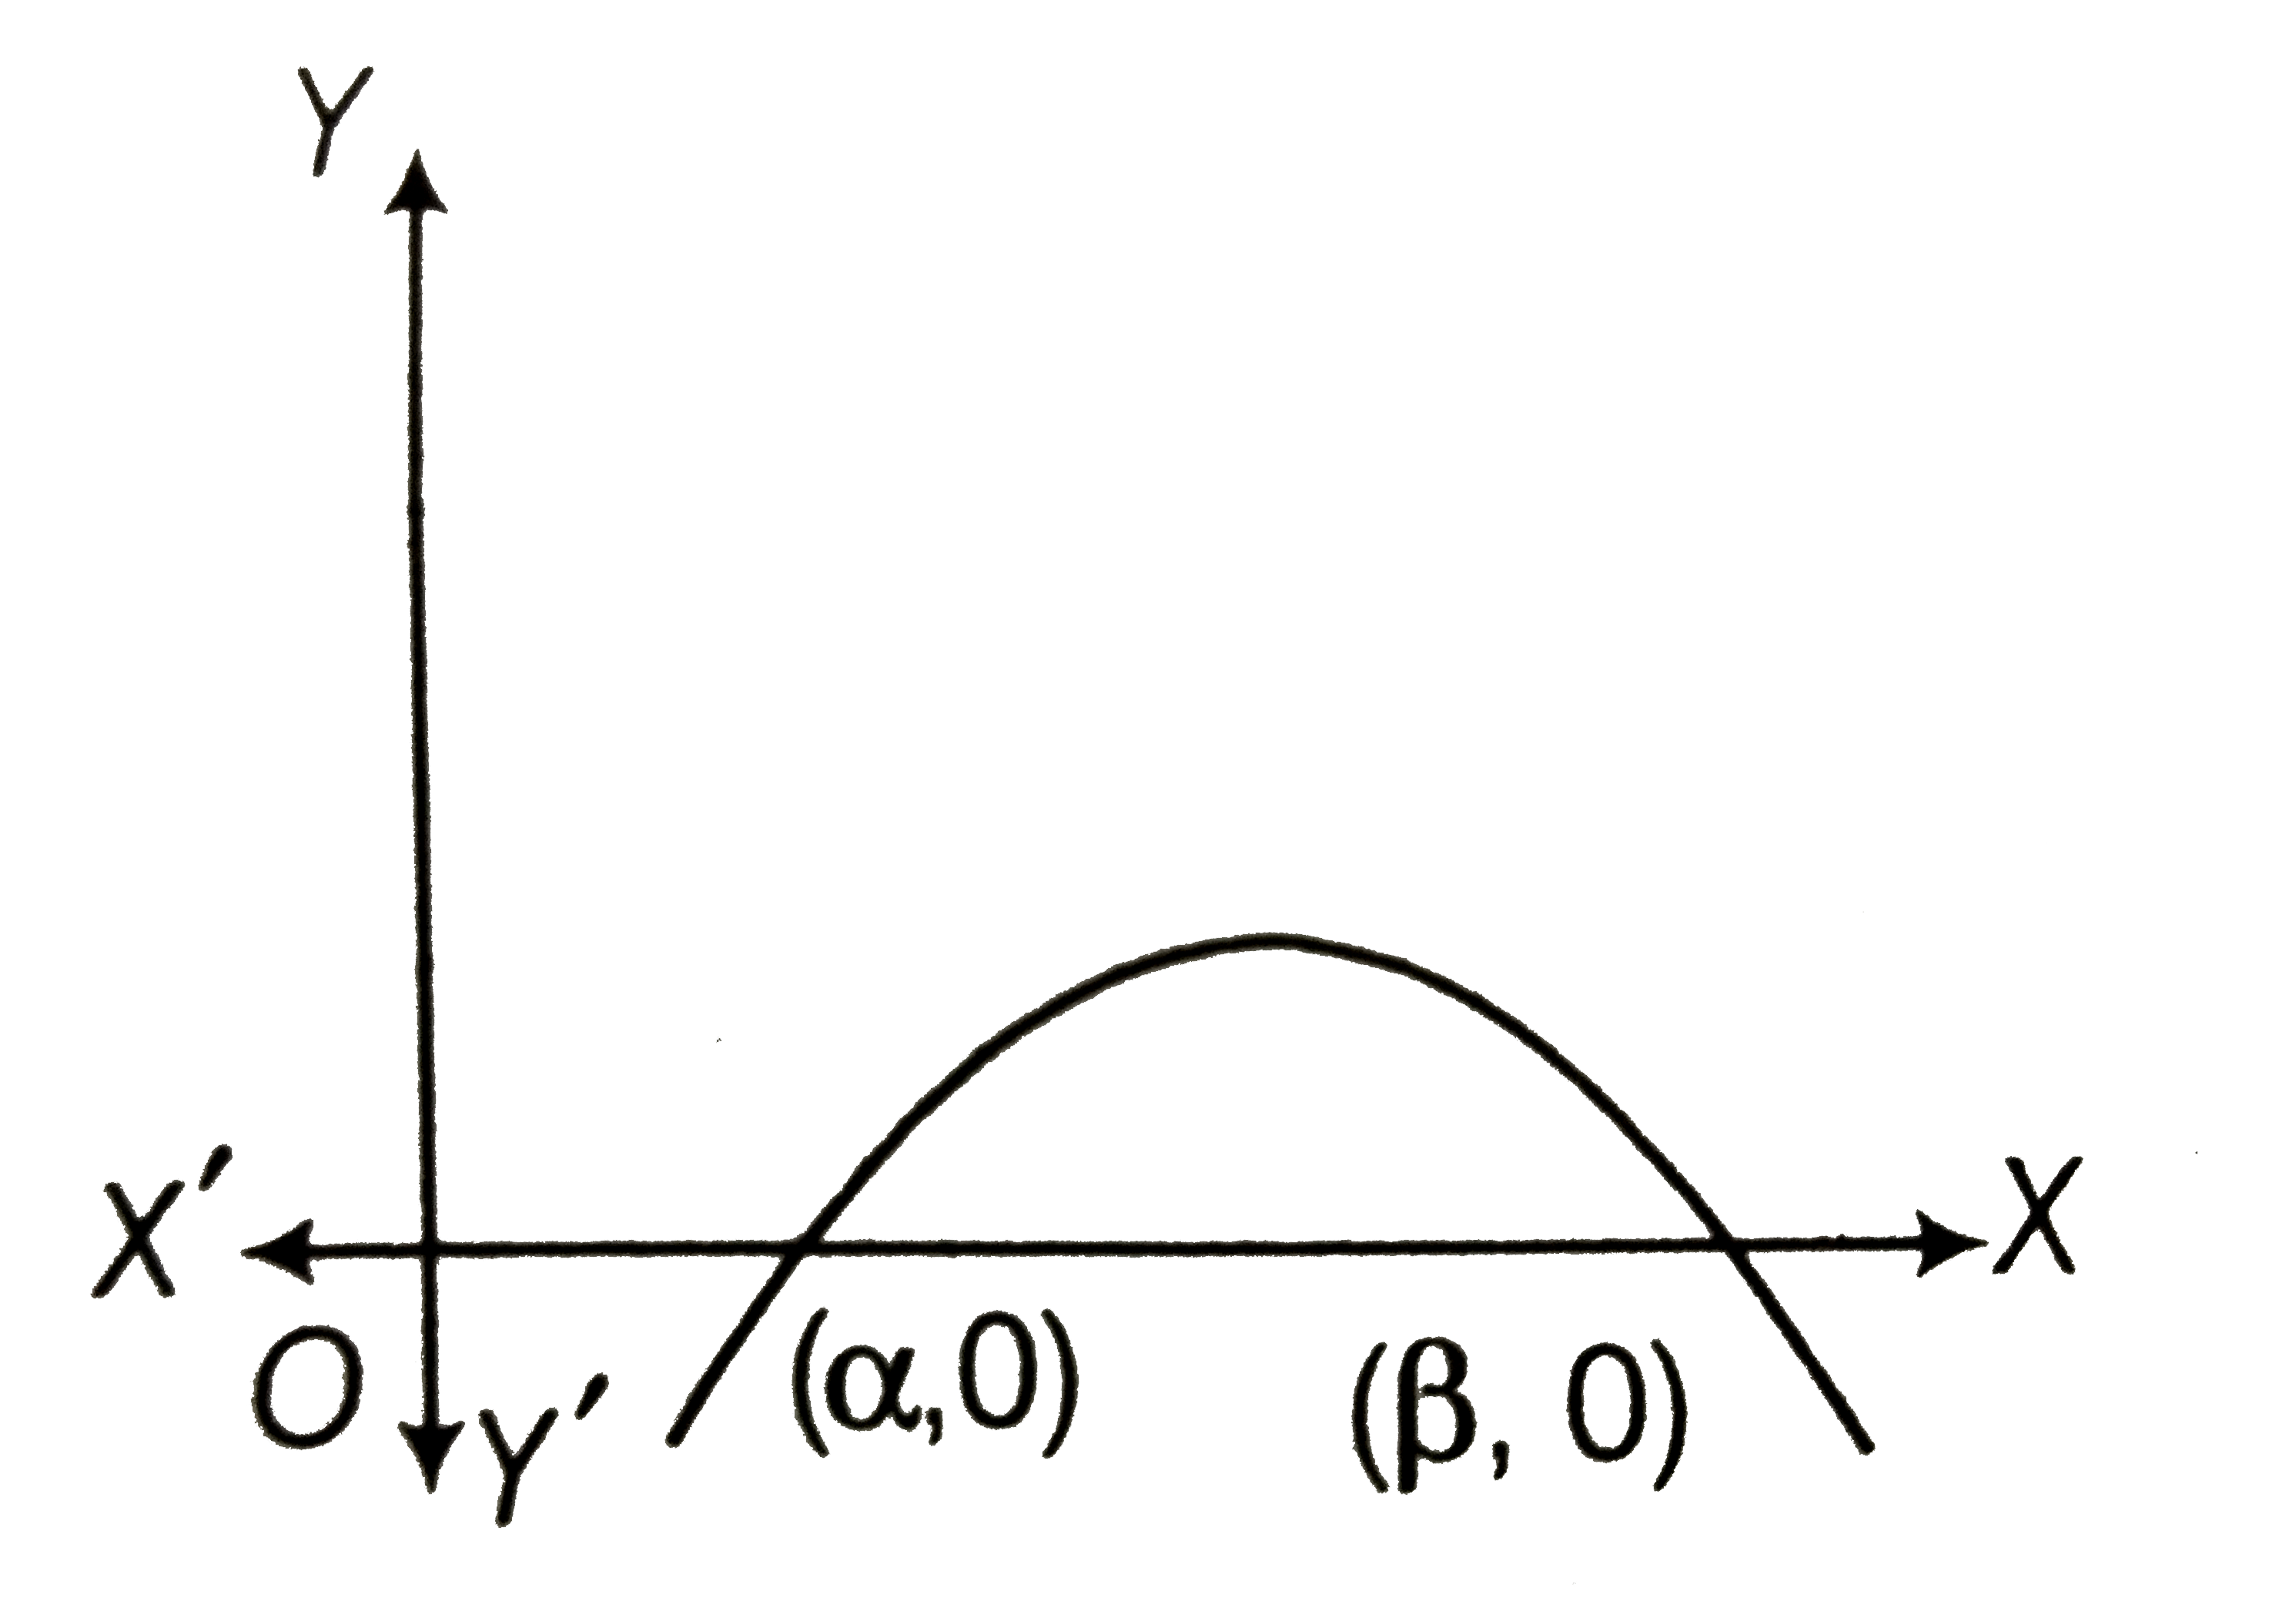
The diagram shows the grap of y=ax2+bx+c. Then
A
a>0
B
b2−4ac<0
C
c>0
D
b2−4ac=0
Video Solution
Text Solution
The correct Answer is:C
|
Answer
Step by step video & image solution for The diagram shows the grap of y=ax^(2)+bx+c. Then by Maths experts to help you in doubts & scoring excellent marks in Class 12 exams.
Updated on:21/07/2023Topper's Solved these Questions
- QUADRATIC EQUATIONBOOK - MOTIONCHAPTER - QUADRATIC EQUATIONEXERCISE - EXERCISE -2 (MCQ)
9 Videos
- QUADRATIC EQUATIONBOOK - MOTIONCHAPTER - QUADRATIC EQUATIONEXERCISE - EXERCISE -3 (SUBJECTIVE)
36 Videos
- QUADRATIC EQUATIONBOOK - MOTIONCHAPTER - QUADRATIC EQUATIONEXERCISE - EXERCISE -1 (OBJECTIVE PROBLEMS)
30 Videos
- PERMUTATION AND COMBINATION BOOK - MOTIONCHAPTER - PERMUTATION AND COMBINATION EXERCISE - EXAMPLE
23 Videos
- SEQUENCE & SERIES BOOK - MOTIONCHAPTER - SEQUENCE & SERIES EXERCISE - Exercise -4 Level -II Previous Year /JEE Advanced
22 Videos
Similar Questions
Knowledge Check
Shows graph of y=ax2+bx+c . Then which one of the following is not true.
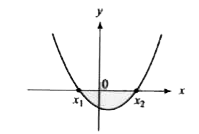 Aa>0Bc<0Cb2−4ac>0Db>0
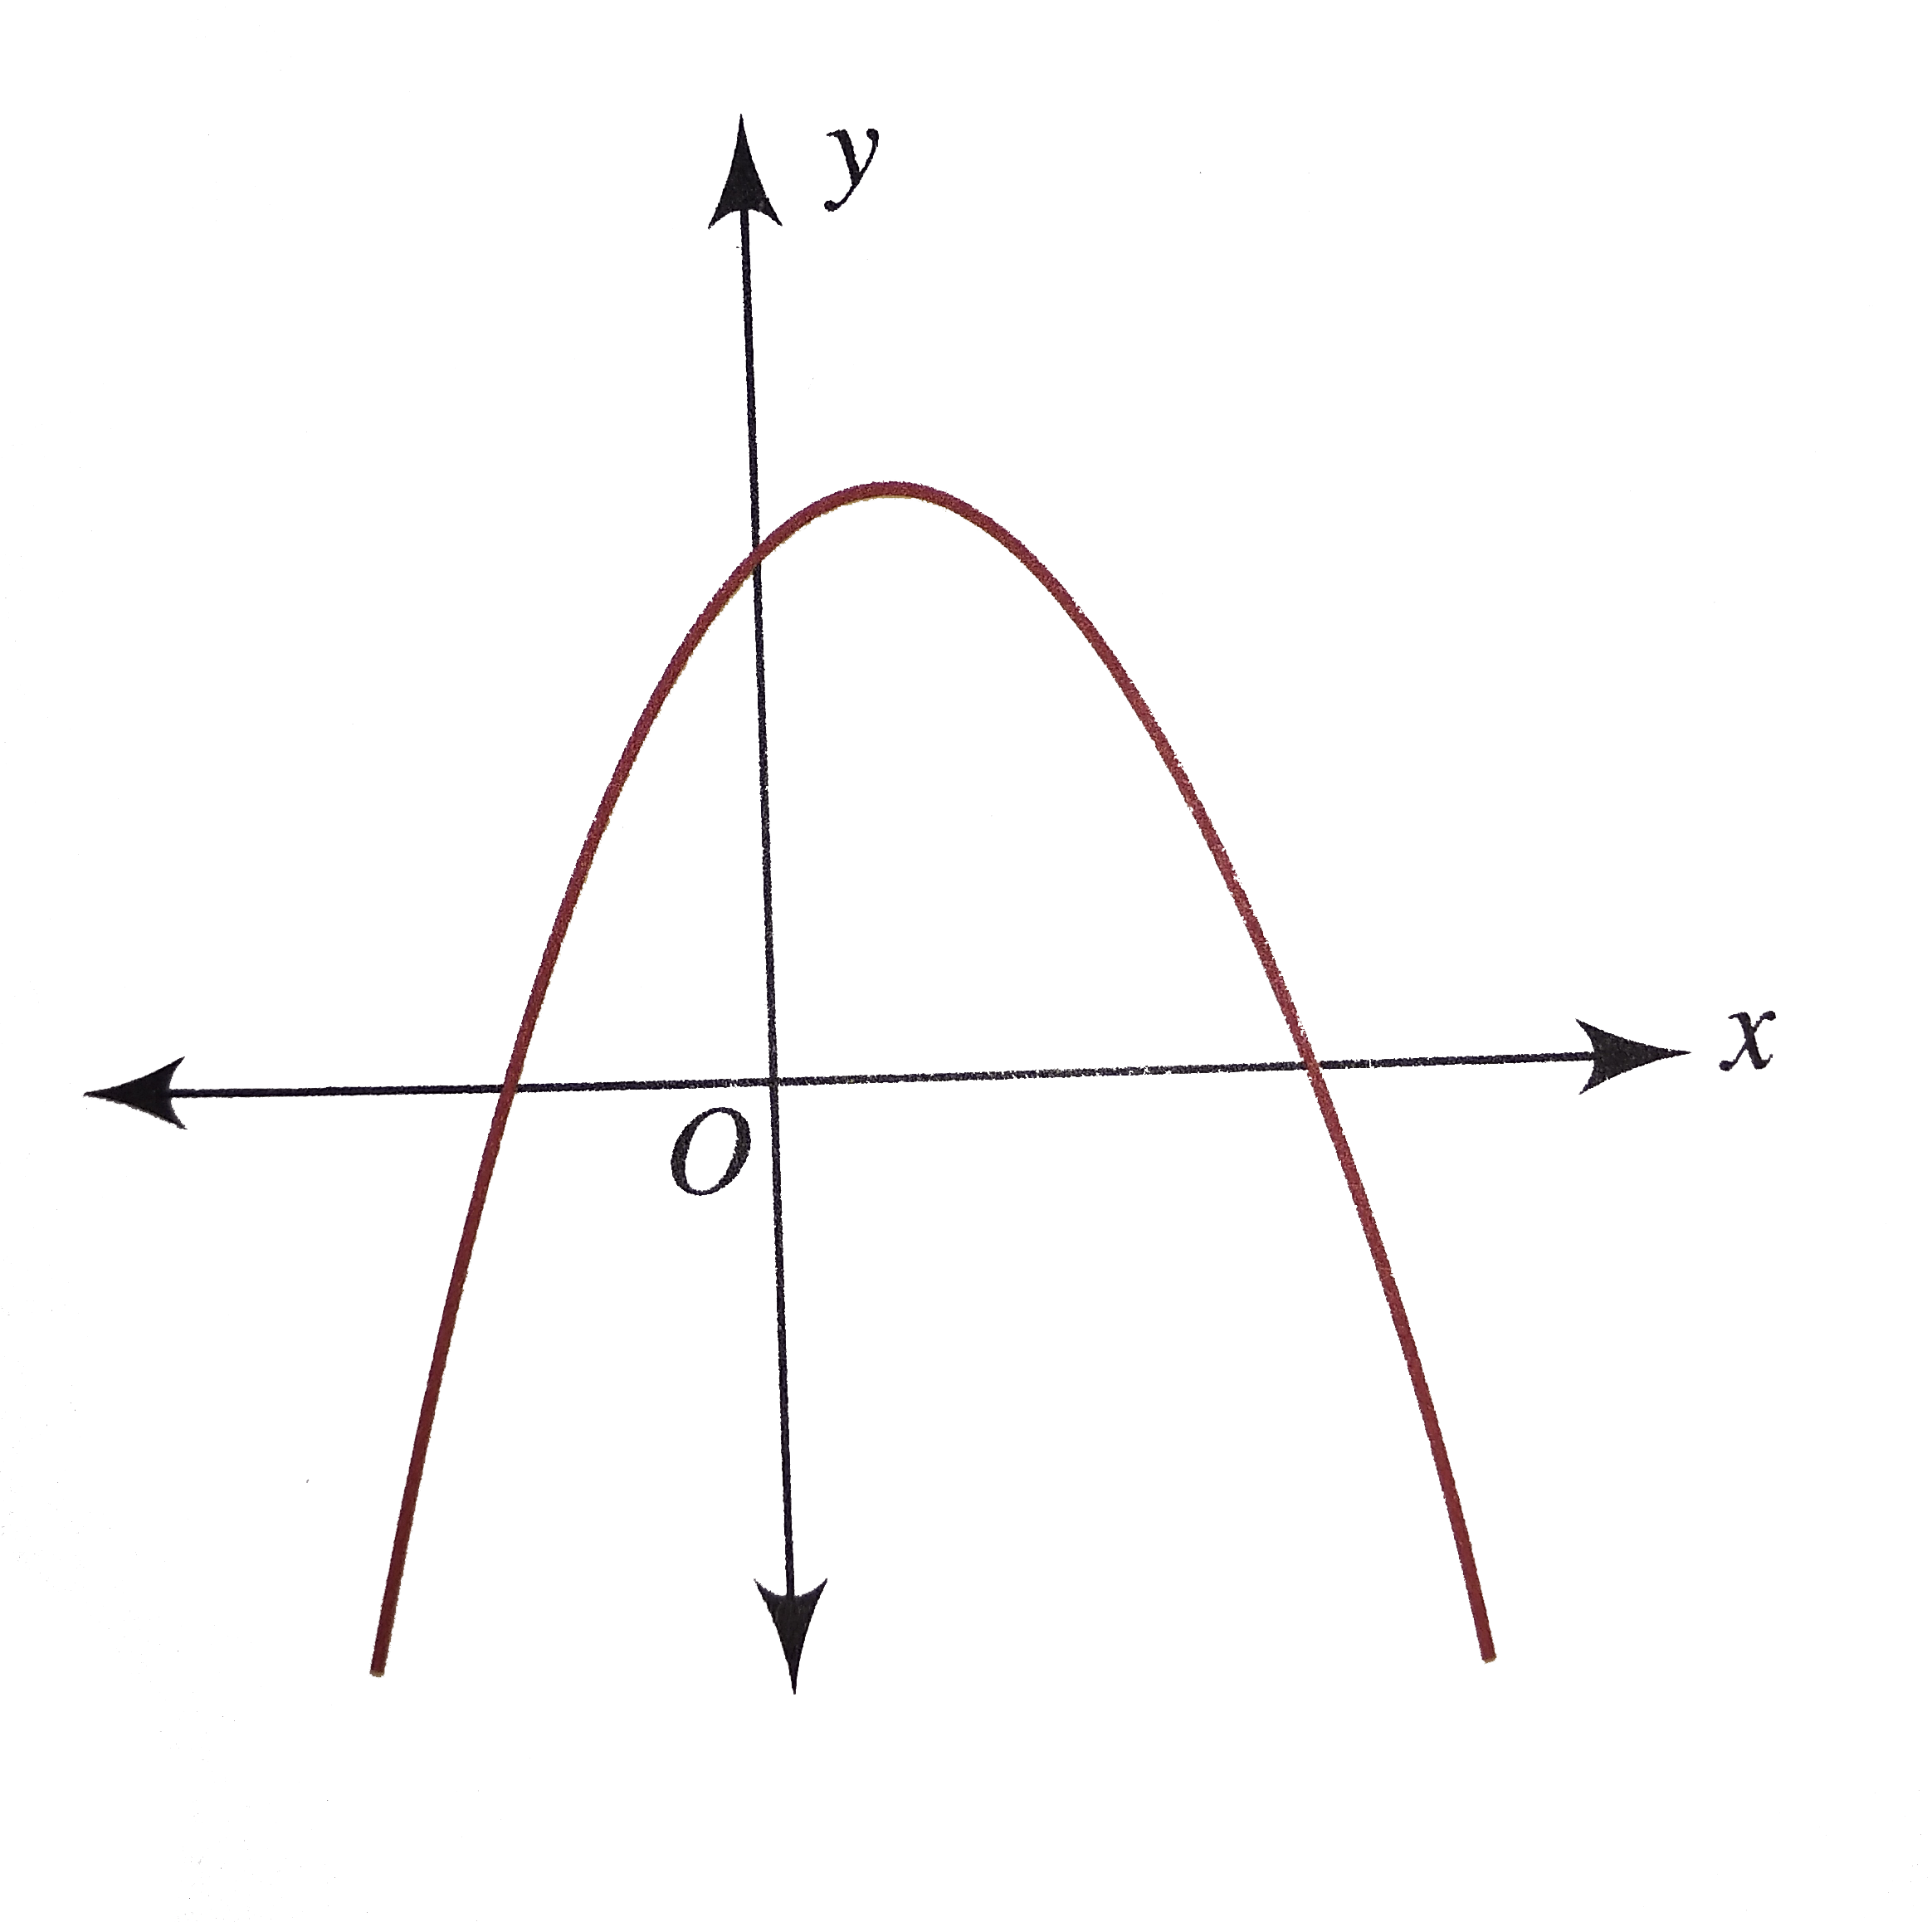
The following figure shows the graph of f(x)=ax2+bx+c, find the sign of a,bandc.
View SolutionFocus of parabola y=ax2+bx+c is
View Solution(ax2+bx+c)6
View SolutionFind the roots of ax^2+bx+c
View SolutionThe adjoining graph of y=ax2+bx+c shows that
View Solution∫(ax2+bx+c)dx
View SolutionThe graph of the quadratic polynomial y=ax2+bx+c is as shown in the figure.Then
View Solution

