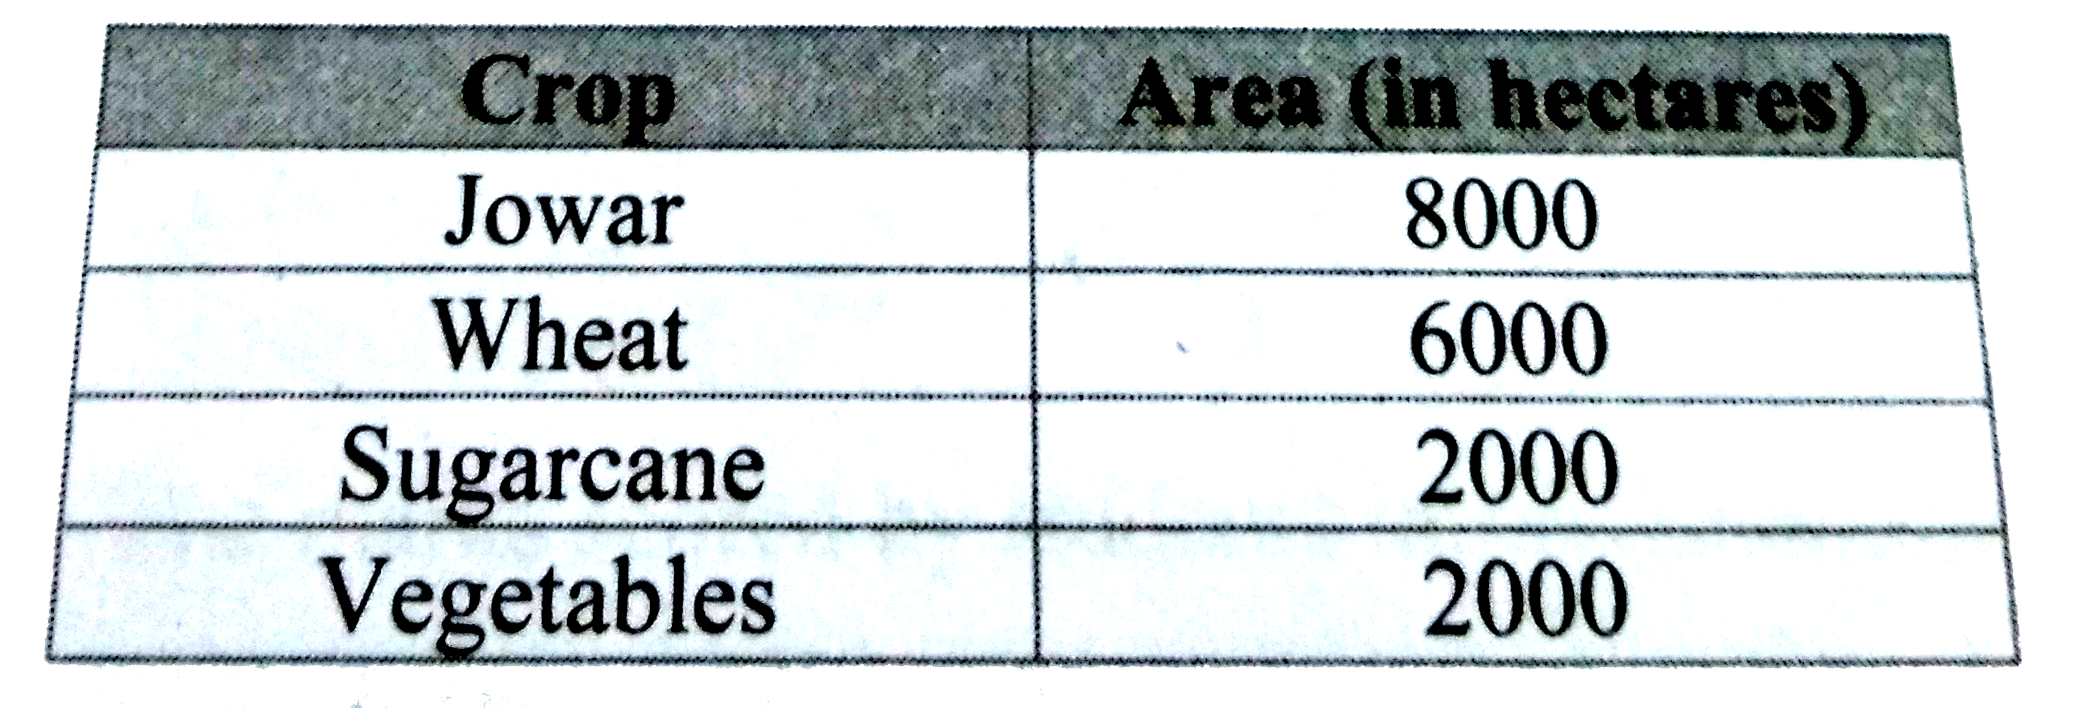
The area under different crops in a certain village is given below. Draw a pie diagram showing the information.
CropJowarWheatSugar caneVegetableArea (in hectares) 40 60 50 30
The correct Answer is:Measures of the central angles for
(i) Jowar : 80∘
(ii) Wheat : 120∘
(iii) Sugar cane : 100∘
(iv) Vegetables : 60∘
Step by step video, text & image solution for The area under different crops in a certain village is given below. Draw a pie diagram showing the information. {:("Crop","Jowar","Wheat","Sugar cane","Vegetable"),("Area (in hectares)"," "40," "60," "50," "30):} by Maths experts to help you in doubts & scoring excellent marks in Class 10 exams.
Topper's Solved these Questions
- BOOK - NAVNEET PUBLICATION - MAHARASHTRA BOARDCHAPTER - MODEL QUESTION PAPEREXERCISE - SOLVE ANY ONE OF THE FOLLOWING SUBQUESTIONS :2videos
MODEL QUESTION PAPER
- BOOK - NAVNEET PUBLICATION - MAHARASHTRA BOARDCHAPTER - MODEL QUESTION PAPEREXERCISE - CHOOSE THE CORRECT ALTERNATIVE :4videos
MODEL QUESTION PAPER
- BOOK - NAVNEET PUBLICATION - MAHARASHTRA BOARDCHAPTER - MODEL QUESTION PAPEREXERCISE - COMPLETE ANY ONE OF THE FOLLOWING ACTIVITIES :2videos
MODEL QUESTION PAPER
- BOOK - NAVNEET PUBLICATION - MAHARASHTRA BOARDCHAPTER - MENSURATIONEXERCISE - Assignment 8.58videos
MENSURATION
- BOOK - NAVNEET PUBLICATION - MAHARASHTRA BOARDCHAPTER - PRACTICE QUESTION BASEDEXERCISE - STATISTICS13videos
PRACTICE QUESTION BASED
Similar Questions
Knowledge Check
- Question 1 - Select One
Answer the questions on the basis of the information given below.
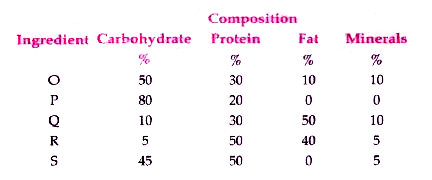
A health-drink company's R&D department is trying to make various diet formulations, which can be used for certain specific purposes. It is considering a choice of 5 alternative ingredients (O, P, Q, R and S), which can be used in different proportions in the formulations. The table below gives the composition of these ingredients. The cost per unit of each of these ingredients is O: 150, P: 50,Q:200, R: 500, S: 100.

In what proportion P, Q and S should be mixed to make a diet having at least 60% carbohydrate at the lowest per unit cost?A2:1:3B4:1:2C2:1:4D3:1:2
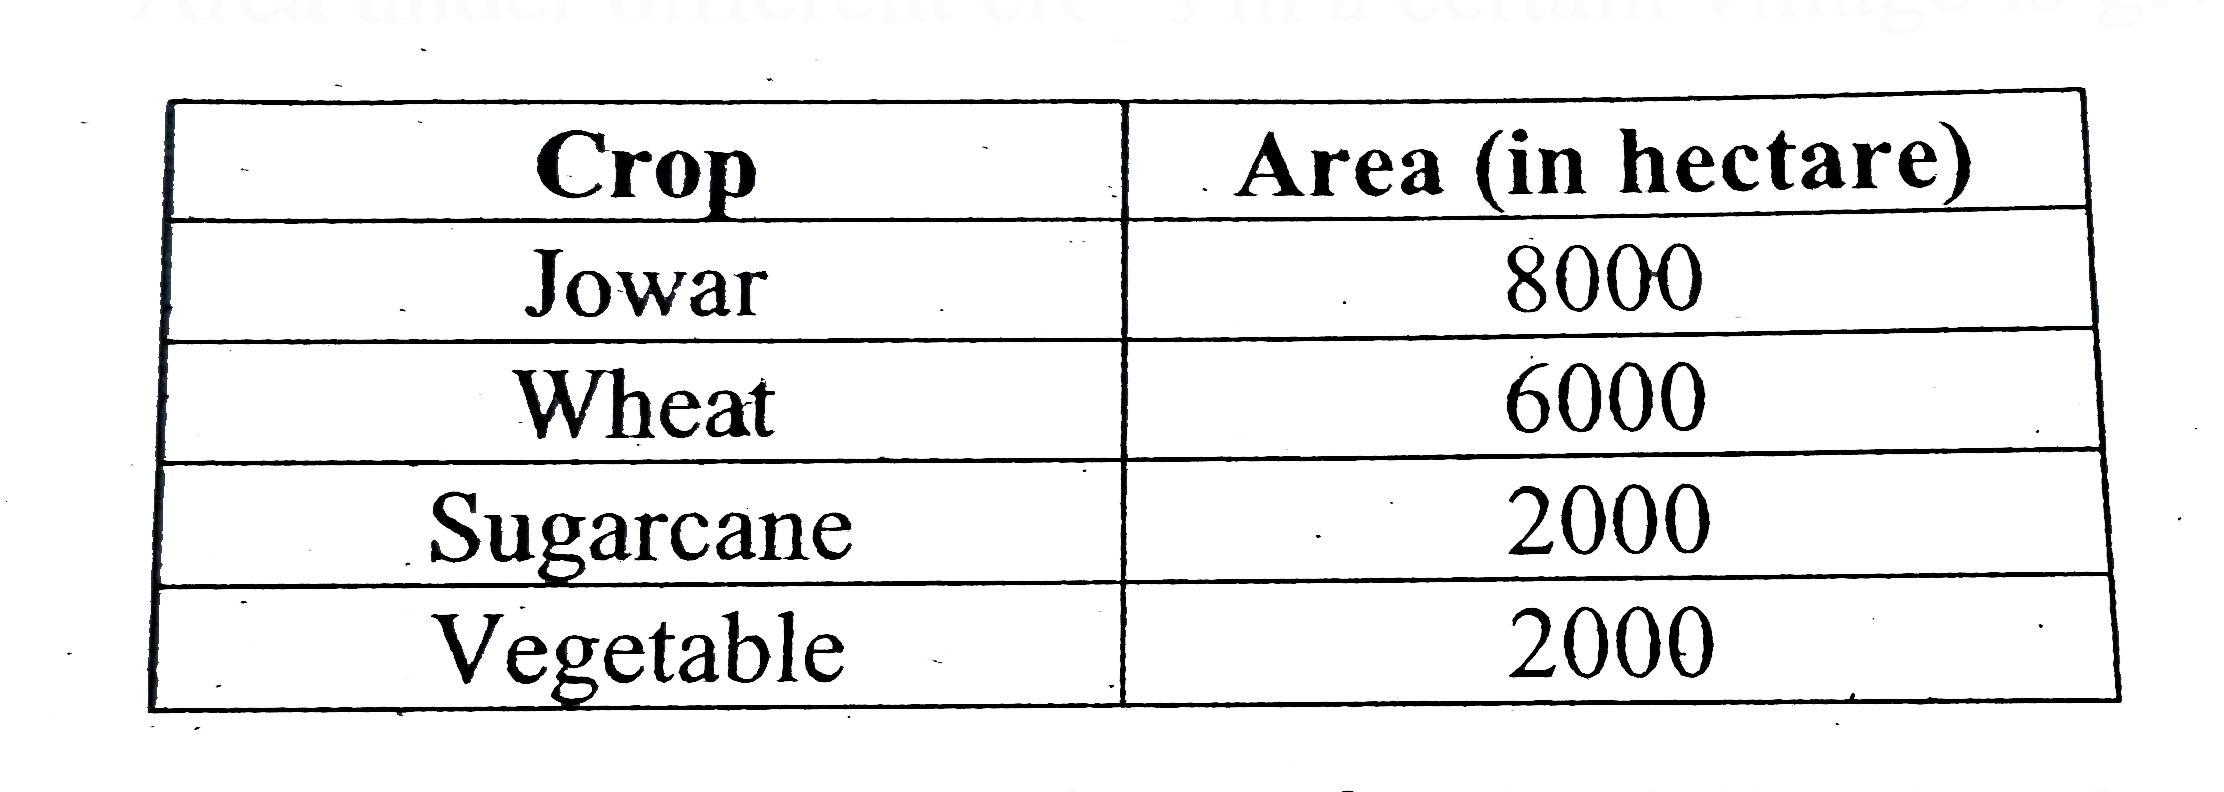
Area under different crops n a certain village is given below : Represent, it by a pie diagram:
 View Solution
Area under different crops n a certain village is given below : Represent, it by a pie diagram:
 View Solution
Percentage of the different products of a village in a particular district are given below. Draw a pie chart representing this information. Items, Wheat, Pulses, Jwar, Grounnuts, Vegetables, Total %, 1253 , 1256 , 252 , 503 , 503 , 100
View SolutionIn a tree plantation programme, the number of trees planted by students of different classes is given in the following table. Draw a pie diagram showing the information.
 View Solution
In a tree plantation programme, the number of trees planted by students of different classes is given in the following table. Draw a pie diagram showing the information.
 View Solution
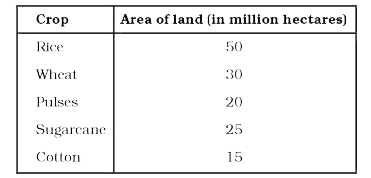
The following table shows the area of the land on which different crops were grown.

Prepare a pictograph by choosing a suitable symbol to represent 10 million hectares.View SolutionIn one day the sales (in rupees) of different items of a baker’s shop are given below: Items, Ordinary bread, Fruit bread, Cakes and Pastries, Biscuits, Other, Total Sales (in Rs.), 260, 40, 100, 60, 20, 480 Draw a pie-chart representing the above sales.
View Solution


