Percentage of the different products of a village in a particular district are given below. Draw a pie chart representing this information. Items, Wheat, Pulses, Jwar, Grounnuts, Vegetables, Total %, 1253 , 1256 , 252 , 503 , 503 , 100
Step by step video & image solution for Percentage of the different products of a village in a particular district are given below. Draw a pie chart representing this information. Items, Wheat, Pulses, Jwar, Grounnuts, Vegetables, Total %, (125)/3 , (125)/6 , (25)/2 , (50)/3 , (50)/3 , 100 by Maths experts to help you in doubts & scoring excellent marks in Class 8 exams.
Updated on:21/07/2023Topper's Solved these Questions
Similar Questions
The area under different crops in a certain village is given below. Draw a pie diagram showing the information.
CropJowarWheatSugar caneVegetableArea (in hectares) 40 60 50 30
View SolutionThe following table shows the household expenditure of family on different items. Draw a pie chart to represent the given data.
ItemRentFoodClotingEducationOthersExpenditure25%30%10%15%20%
View Solution
Knowledge Check
The pie chart given below shows sale of different types of cars in a city for a given year. The total sale of cars in the city is 600000.
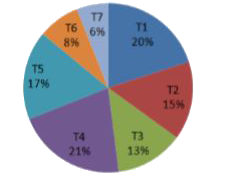
What is the sum of total number of cars sold of type T5, T6 and T3?A232000B228000C245000D252000The pie-chart below shows percentage of money spent on different sports in a state in a particular year. The total amount spent on all sports is Rs. 150 crore.
Answer the following questins on the basis of data given in the chart below.
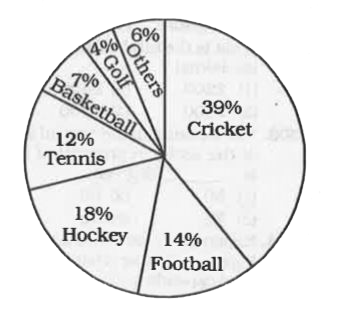
The total money spent on Football and Golf together is equal to the spent money of which single sport ?ATennisBHockeyCCricketDNone of theseThe pie chart given below shows the number of tigers in different zoos. The number of tigers in a particular zoo are shown as a percentage of total number of tiger in all the zoos together.
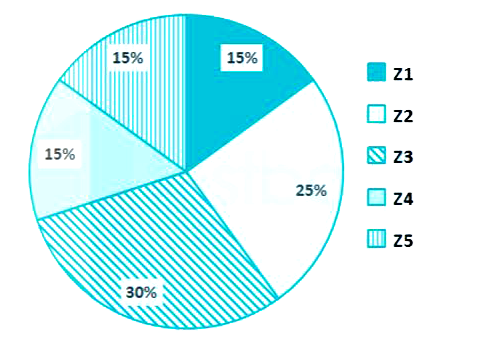
What is the difference in central angle of the sectors for Z1 and Z3?A18∘B72∘C36∘D54∘
Draw a pie-diagram representing the relative frequencies (expressed as percentage) of the eight classes as given below: 12.6, 18.2, 17.5, 20.3, 2.8, 4.2, 9.8, 14.7
View SolutionThe number of students admitted in different faculties of a college are given below: Faculty, Science, Art, Commerce, Law, Edu., Total No. of Student, 1000, 1200, 650, 450, 300, 3600 Draw a pie-chart to represent the above information.
View SolutionThe pie-chart below shows percentage of money spent on different sports in a state in a particular year. The total amount spent on all sports is Rs. 150 crore.
Answer the following questins on the basis of data given in the chart below.
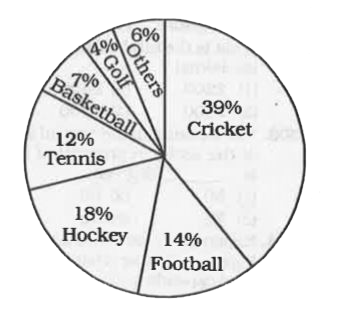
How much more amount is spent on Cricket than the money spent on Hockey and Football together ?
View SolutionThe pie-chart below shows percentage of money spent on different sports in a state in a particular year. The total amount spent on all sports is Rs. 150 crore.
Answer the following questins on the basis of data given in the chart below.
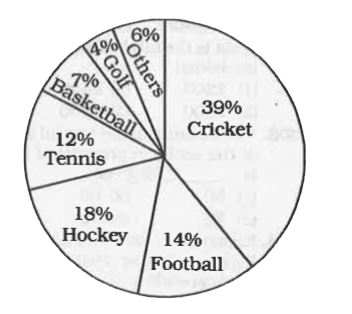
What is the amount of mmoney spent on Cricket and Hockey together?
View SolutionThe pie-chart below shows percentage of money spent on different sports in a state in a particular year. The total amount spent on all sports is Rs. 150 crore.
Answer the following questins on the basis of data given in the chart below.
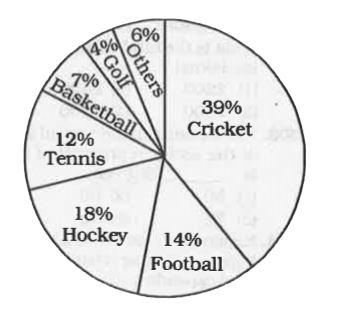
How much more amount is spent on Hockey than that on Football ?
View Solution
