The following table shows the area of the land on which different crops were grown.
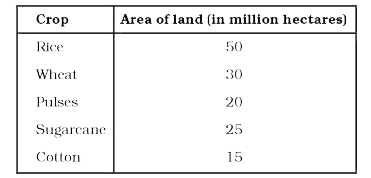
Prepare a pictograph by choosing a suitable symbol to represent 10 million hectares.
Step by step video & image solution for The following table shows the area of the land on which different crops were grown. Prepare a pictograph by choosing a suitable symbol to represent 10 million hectares. by Maths experts to help you in doubts & scoring excellent marks in Class 6 exams.
Updated on:21/07/2023Topper's Solved these Questions
Similar Questions
Knowledge Check
The following table gives the areas of the oceans of the word :
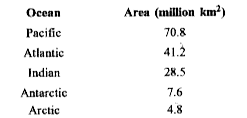
A pie diagram of this data is to be drawn. What is the angle which the sector representing Pacific Ocean subtends at the centre ?A167∘B97∘C67∘D18∘
Annual expenditure of a company in the year 2007-2008 is given below:
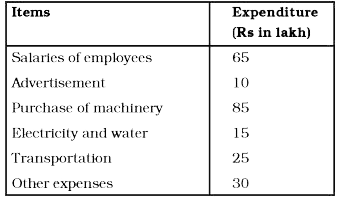
Prepare a pictograph of the above data using an appropriate symbol to represent Rs 10 lakh.
View SolutionThe following table shows the number of students in different classes of a high school. Draw a histogram to represent the given data.
ClassesVIVIIVIIIIXXNumber of students3742355048
View SolutionTotal number of students of a school in different years is shown in the following table.
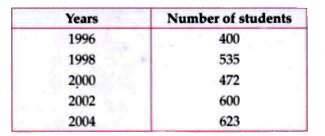
Prepare another pictograph of students using any other symbol each representing 50 students. Which pictograph do you find more informative ?
View SolutionThe following pictograph shows the sale of cars of different colours in a showroom.
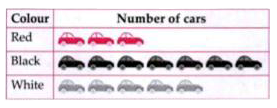

How many less blue cars were sold than red and gray cars together?
View SolutionThe following table shows the monthly expenditure of different families on different items :

Represent the data in the form of a sub-divided bar diagram.
View SolutionThe following table gives information about the circulation of newspapers (dailies) in a town in five languages.

Prepare a pictograph of the above data, using a symbol of your choice, each representing 1000 newspapers.
View SolutionTotal number of animals in five villages are as follows: Village, Number of animals A B C D E, 80 120 90 40 60 Prepare a pictograph of these animals using one symbol to represent 10 animals.
View Solution


