The distribution of heights (in cm) of 96 children is given below
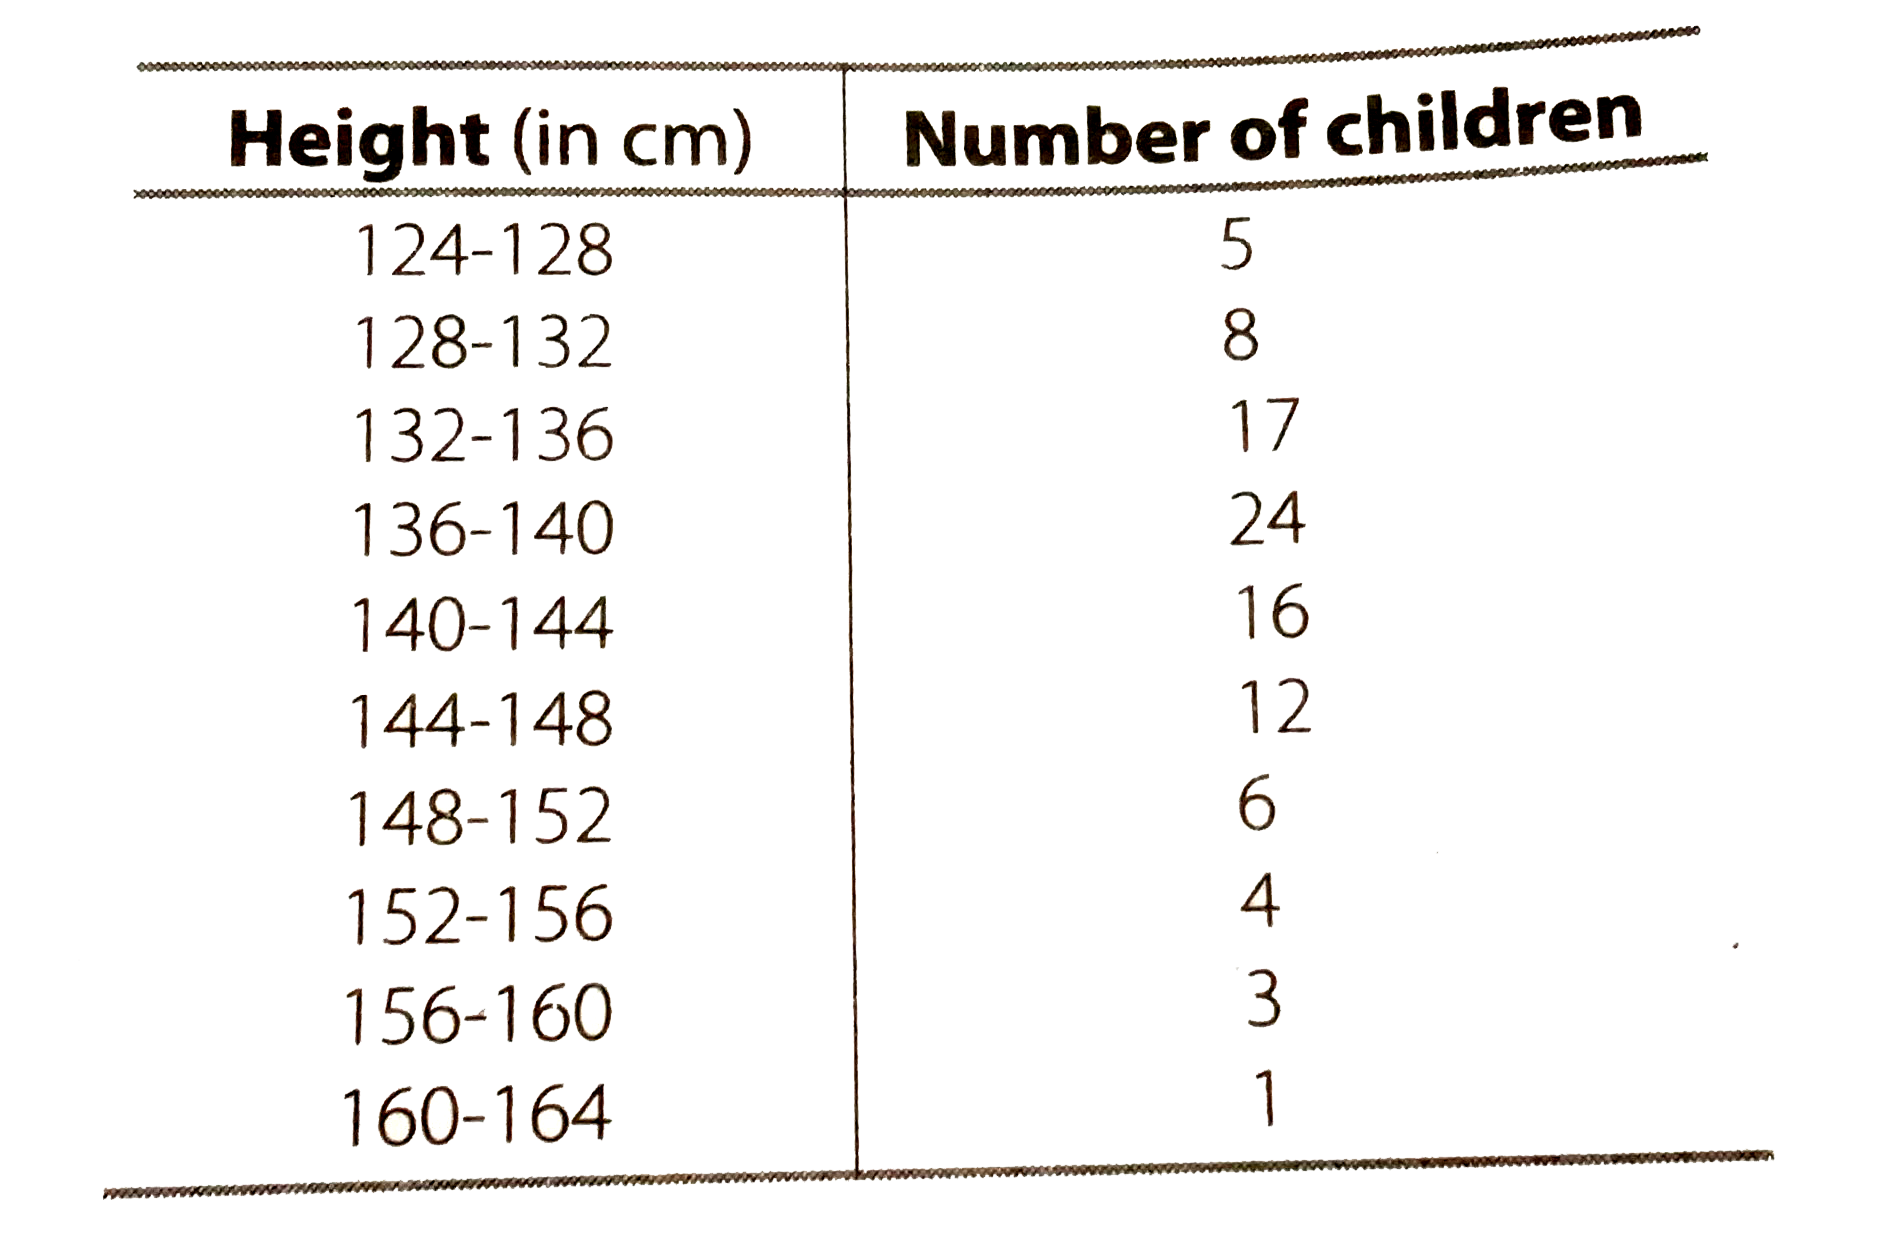
Draw a less type cumulative frequencies curve fo this data and use it to compute meidan height of the children.
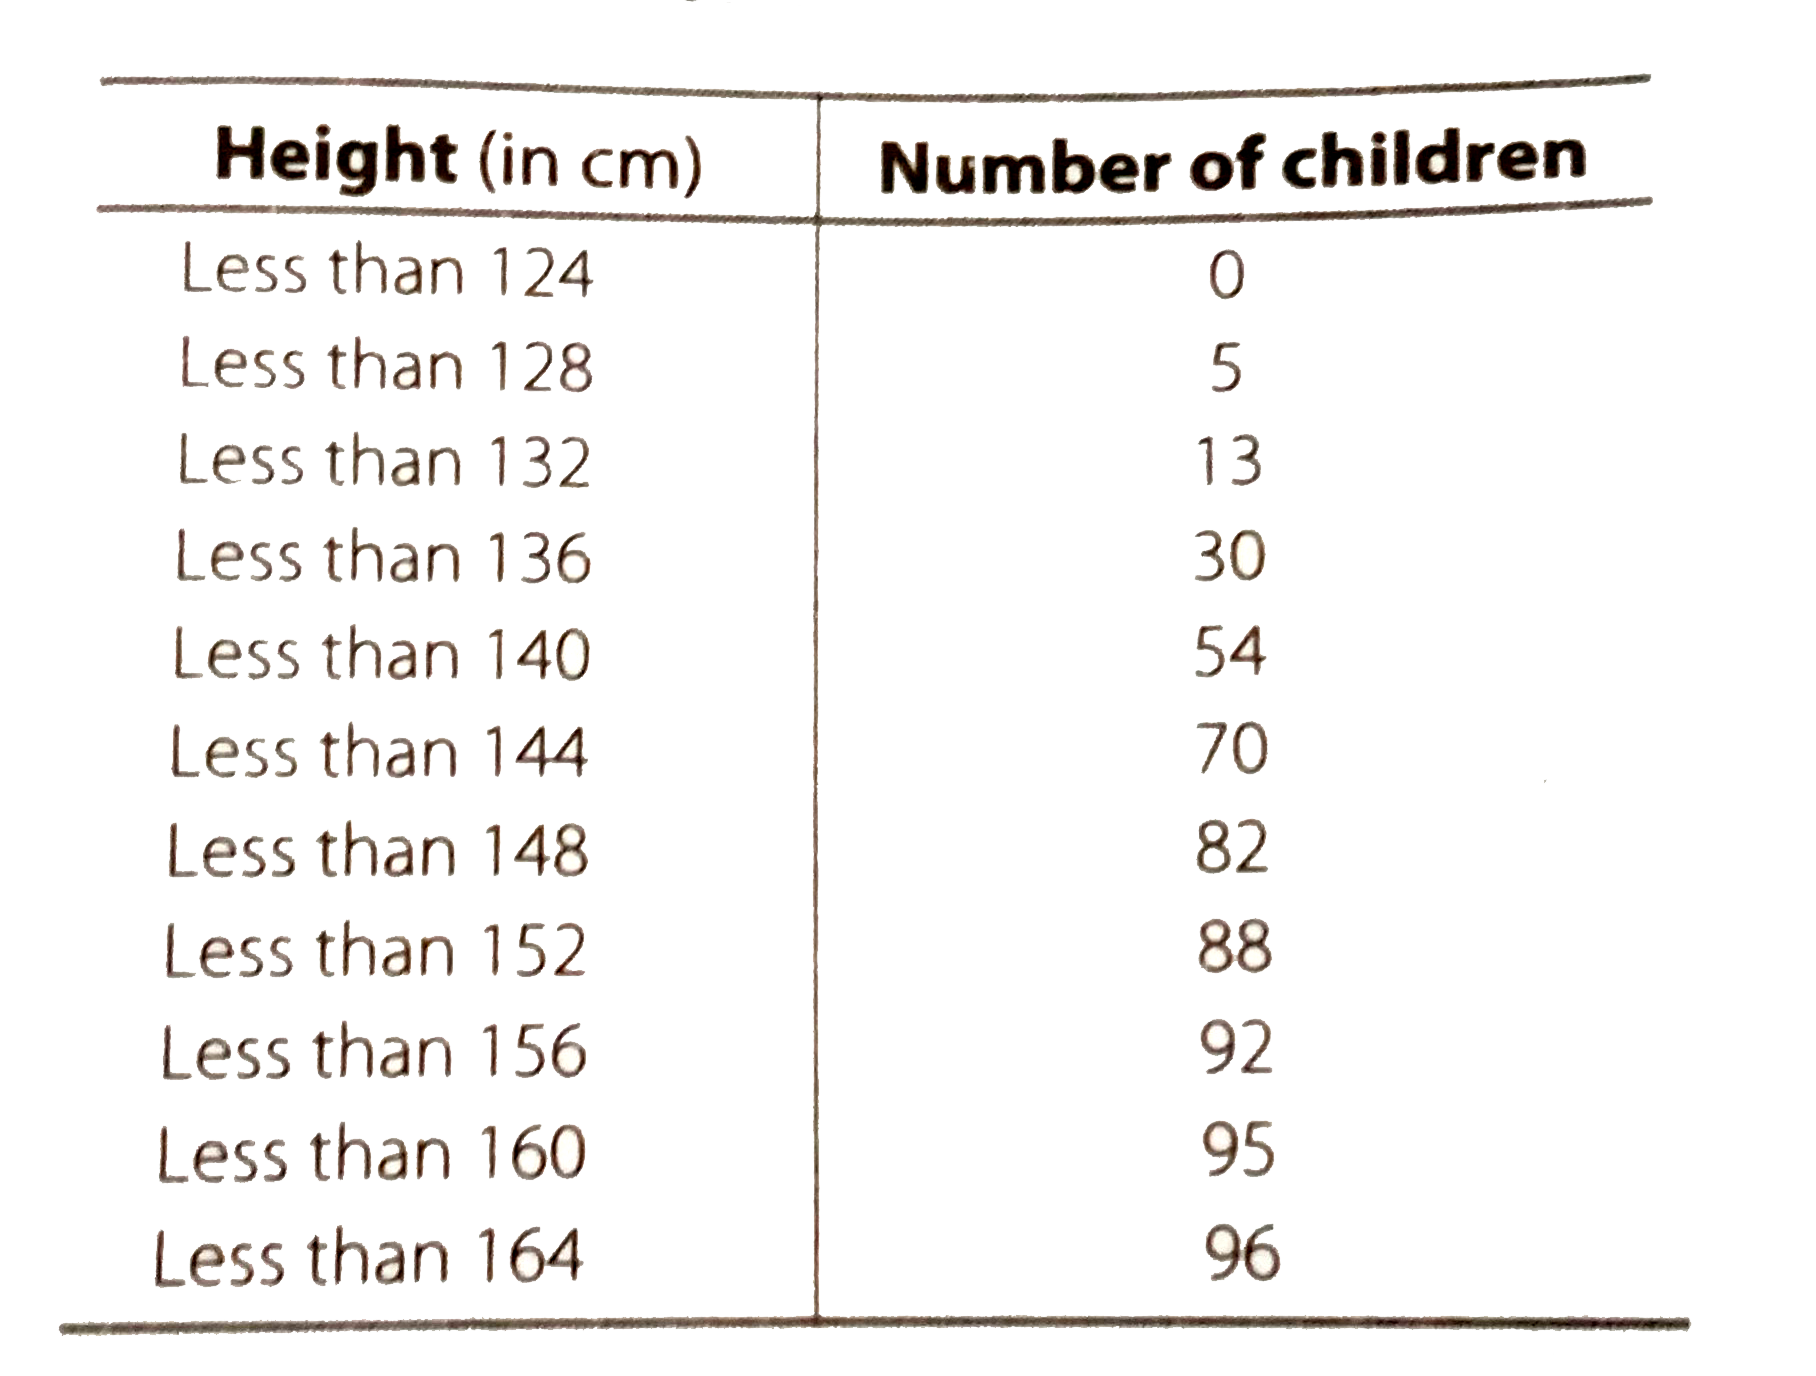
To draw the less than type ogive, we get the points (124,0),(128,5),(132,13),(136,30),(140,54),(144,70),(148,82),(152,88),(156,92),(160,95),(164,96) and join all these points by free hand
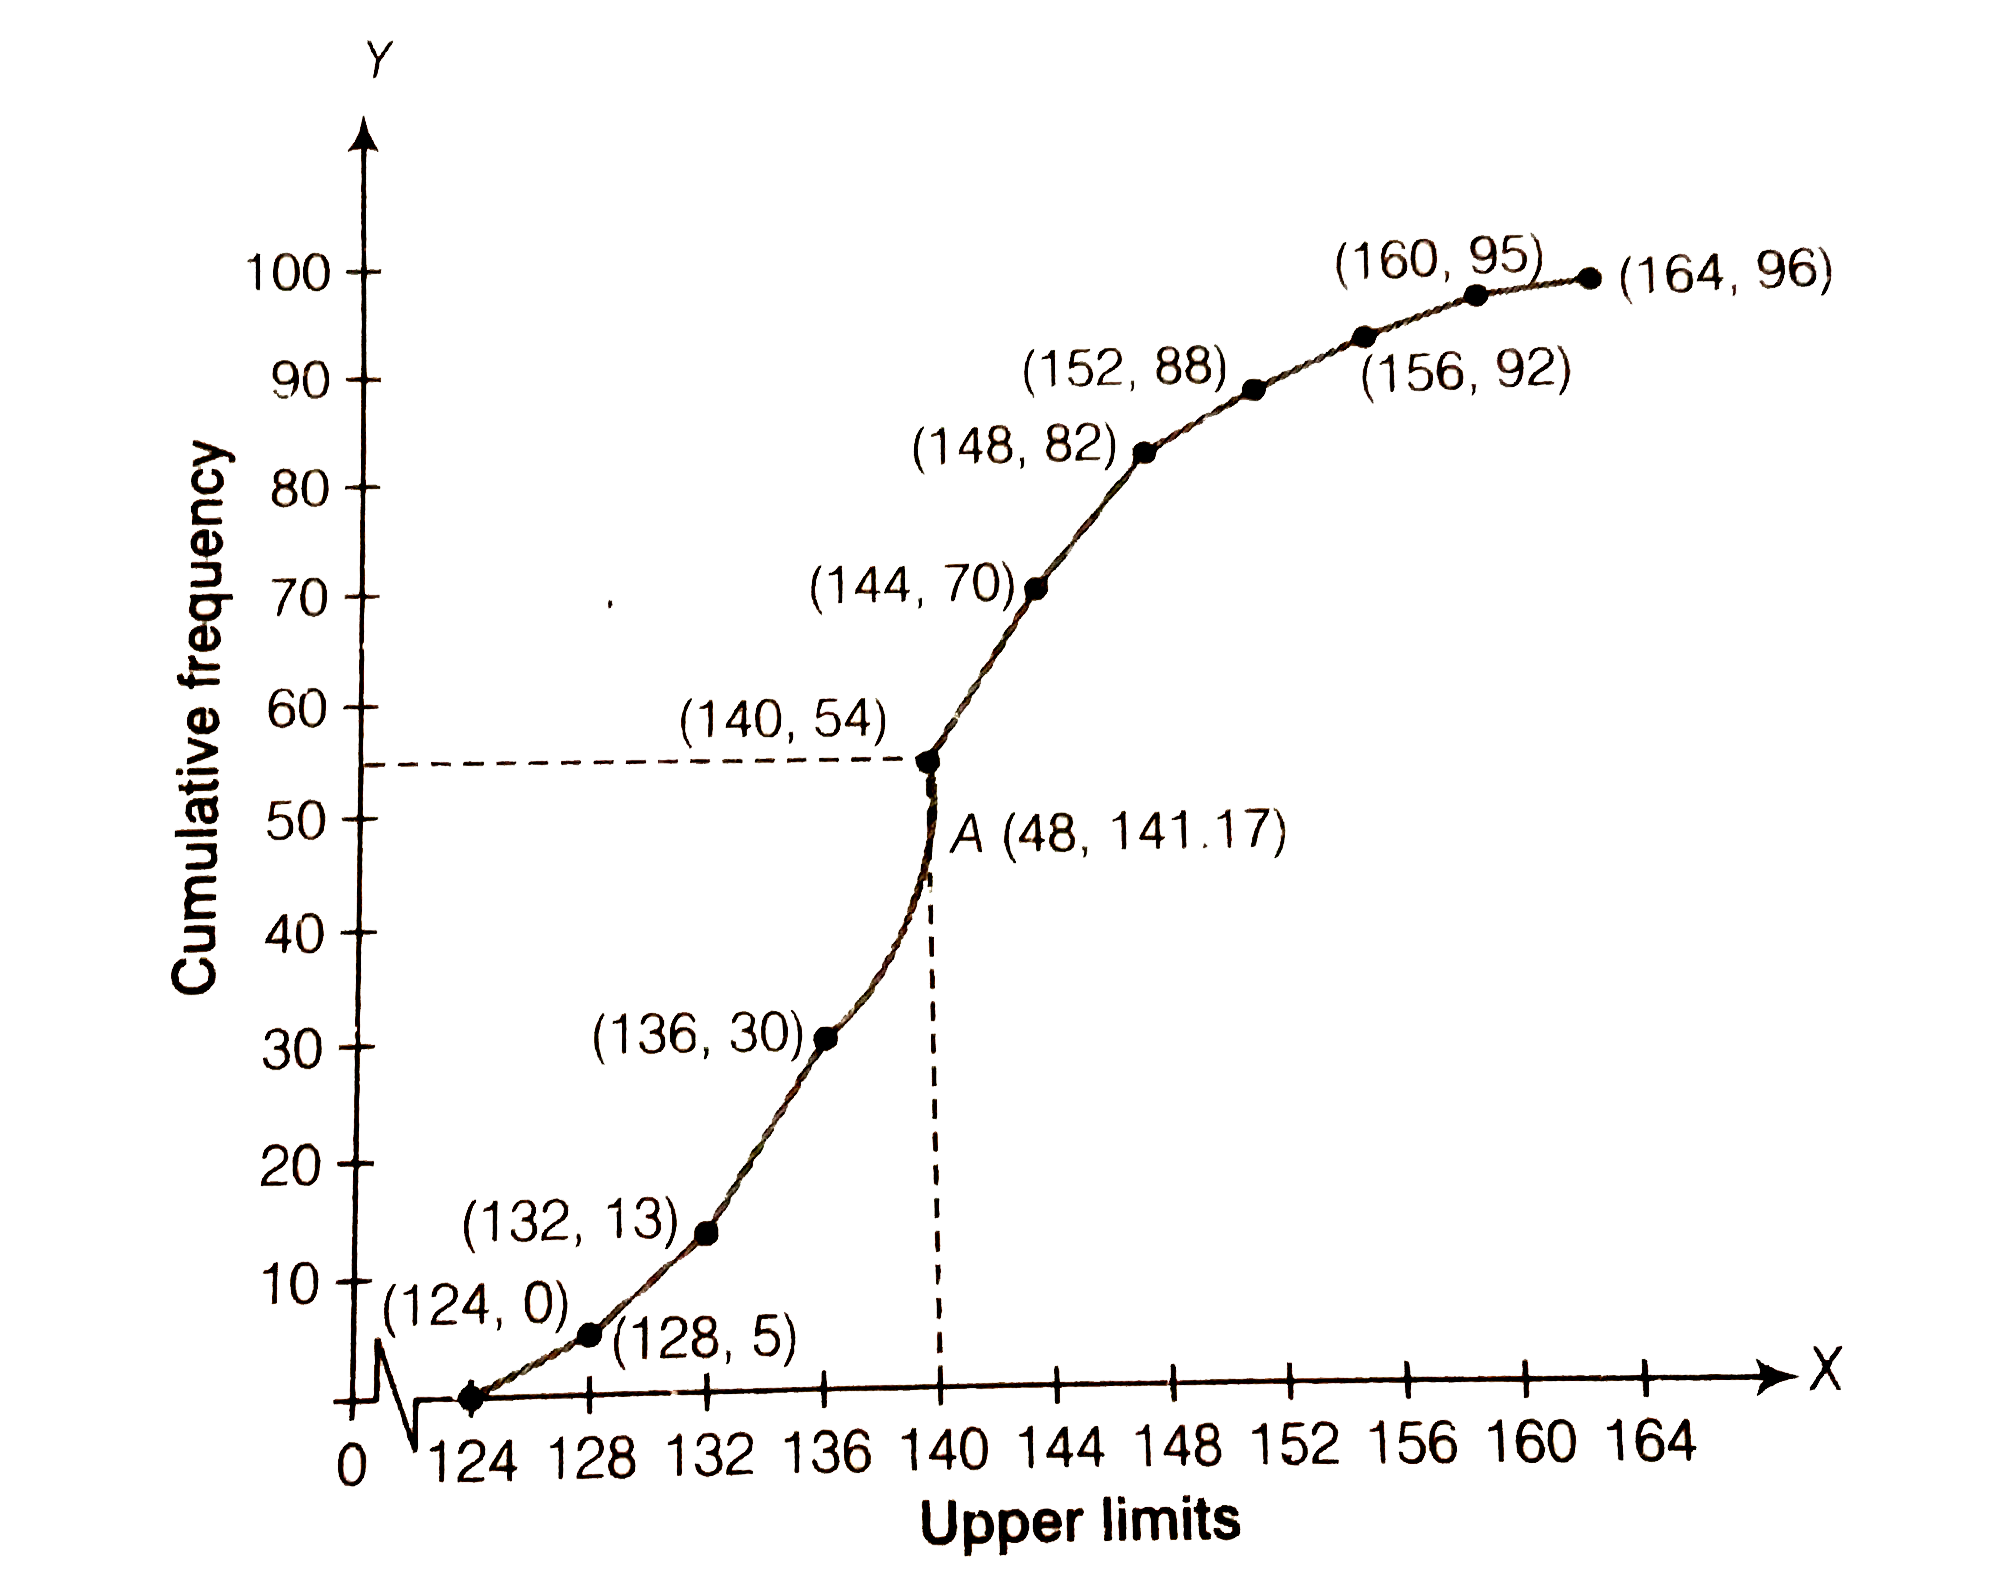
Here, N2=962=48
We take, y=48 in y-cordination and draw a line parallel to X-axis meets the curve at A a draw a perpendicular line from point A to the X-axis and this line meets the X-axis at the point which is the median i.e. median=141.17
Topper's Solved these Questions
- STATISTICS AND PROBABILITYBOOK - NCERT EXEMPLAR ENGLISHCHAPTER - STATISTICS AND PROBABILITYEXERCISE - SHORT ANSWERS QUESTIONS
42 Videos
- REAL NUMBERSBOOK - NCERT EXEMPLAR ENGLISHCHAPTER - REAL NUMBERSEXERCISE - LONG ANSWER TYPE QUESTIONS
5 Videos
- SURFACE AREAS AND VOLUMESBOOK - NCERT EXEMPLAR ENGLISHCHAPTER - SURFACE AREAS AND VOLUMESEXERCISE - LONG ANSWER TYPE QUESTIONS
20 Videos
Similar Questions
The distribution of heights (in cm) of 96 children is given below:
Draw a less than type cumulative frequency curve for this data and use it to compute median height of the children.
View SolutionThe following table shows the distribution of the heights of a group of factory workers :
Draw the 'less than' cumulative frequency curve on graph paper . Use 2 cm = 5 cm height on one axis and 2 cm = 10 workers on the other
Ht. (cm): 150−155155−160160−165165−170170−175175−180180−185 No. of workers 6 12 18 20 13 8 6
View Solution
Knowledge Check
The abscissa of the point of intersection of the less that type of the more than type cumulative frequency curves of a grouped data gives its
AmeanBmedianCmodeDAll of these
The marks obtained by 100 students of class is an examination are given below:
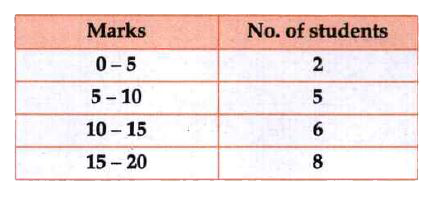
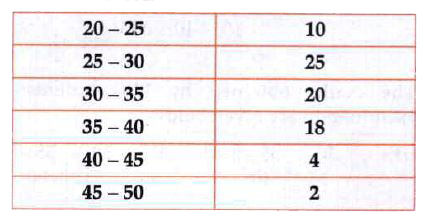
Draw 'a less than' type cumulative frequency curves (ogive). Hence, find median.
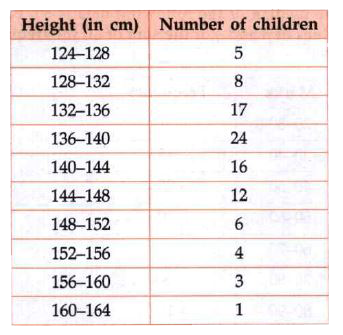
View SolutionThe distribution of heights (in cm) of 96 children is given below. Construct a histogram and a frequency polygon on the same axes. Height (in cm):, 124-128, 128-132, 132-136, 136-140, 140-144, 144-148, 148-152, 152-156, 156-160, 160-164 No. of Children, 5, 8, 17, 24, 16, 12, 6, 4, 3, 1
View SolutionThe following is the distribution of weights (in kg) of 40 persons.

Construct a cumulative frequency distribution (of the less than type) table for the data above.
View SolutionThe following is the distribution of weights (in kg) of 40 persons.

Construct a cumulative frequency distribution (of the less than type) table for the data above.
View SolutionFor the following frequency distribution, draw a cumulative frequency curve of more than type and hence obtain the median value:

View SolutionThe abscissa of the point of intersection of the less that type of the more than type cumulative frequency curves of a grouped data gives its
View SolutionA data constitutes of heights (in cm) of 50 children. What do you understand by mode for the data?
View Solution
